
Travelpayouts reports give you a clear picture of how your blog is doing, with visits, clicks, bookings, and earnings. That’s a good start, but if you’re serious about turning data into revenue, you need to go deeper.
In this post, we’ll tell you how. You’ll find everything from quick wins in reports you already use to the more advanced techniques our partnerships managers rely on.
Tip 1: Zoom in on individual pages
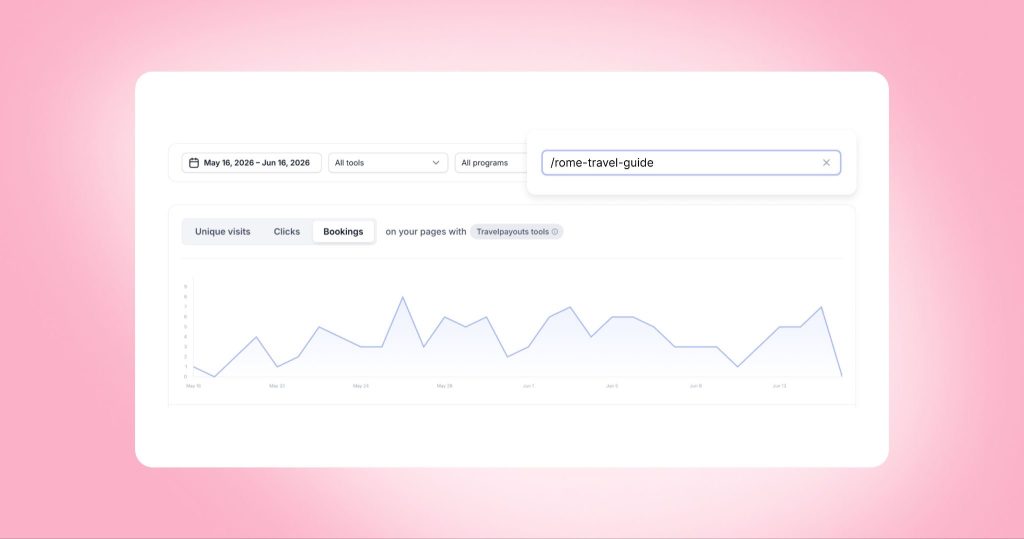
To really improve your performance, you need to understand how specific pages are doing. Content Analytics makes this easy: it instantly builds you a chart showing data for any page over any time period.
This lets you:
- Keep an eye on your evergreen articles.
- See how posts perform after updates (rewrites, affiliate tool substitutions, etc.).
Just paste the URL of the article you’re interested in into Content Analytics’ Page URL field:
Tip 2: Zoom out and look at all your pages
It’s also helpful to get a holistic view, to see how all your articles perform over time. For this you’ll have to go beyond the dashboard – but don’t worry, we’re including a ready-to-use prompt from our partnerships manager Polina.
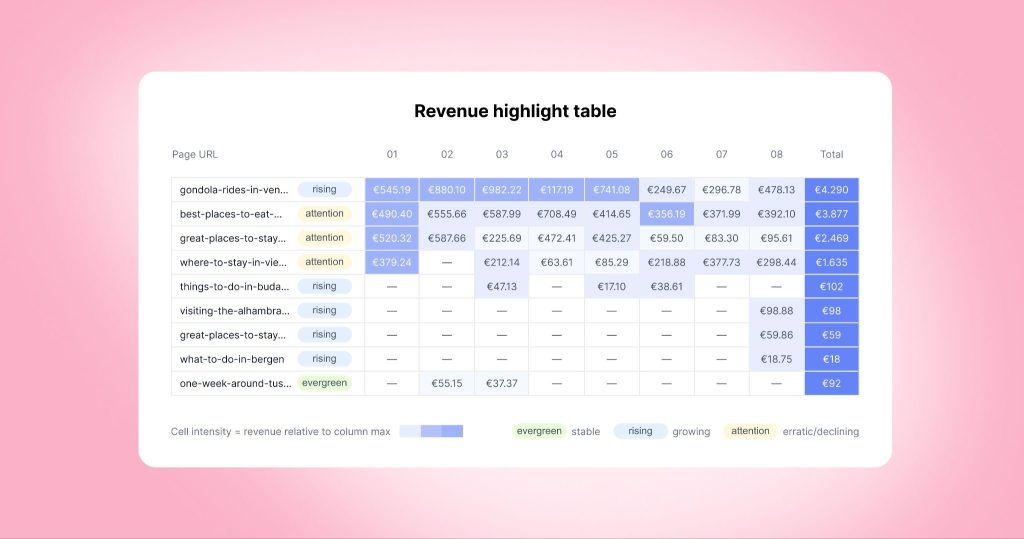
You’ll end up with a highlight table showing which articles are evergreen, which are rising stars, and which need attention.
Look complicated? Thanks to AI, it’s not. Here’s how to generate a table like this in two minutes.
Step 1: Export your data
Go to Reports → Bookings, set the date range to 12 months, and click Download CSV.
Step 2: Check everything with AI
Upload your CSV to any AI model (Polina recommends Claude) and paste the following:
I have a CSV file with booking data. Columns: booked_at (datetime, YYYY-MM-DD HH:MM:SS), page_url, action_state (processing / paid / cancelled), total_profit (float), bookings_pending_profit (float). Please do the following:
1. Filter out cancelled bookings (action_state != ‘cancelled’)
2. Calculate revenue = total_profit + bookings_pending_profit
3. Extract month from booked_at in YYYY-MM format
4. Build a pivot table: rows = page_url (short slug only, without domain), columns = month (sorted chronologically), values = sum of revenue, empty cells = 0
5. Add a Total column (sum of revenue across all months per URL)
6. Round all values to 2 decimal places
7. Sort by Total descending
8. Visualize as a highlight table: color each cell with a blue gradient – the darker/more saturated the blue, the higher the value. Use per-column normalization (each month column scaled independently) so contrast is visible even in low-revenue months. The Total column uses its own scale. Empty cells (0) show “—” with no fill. Display short URL slugs (no domain). Use € as currency symbol. Bold the Total column values.
9. Identify evergreen articles (stable revenue year-round), rising stars (growing month over month), and articles that need attention (revenue dropping or inconsistent).

Polina here! I’m a partnerships manager at Travelpayouts, which means I help our partners set up their blogs for monetization success ☺️
Once you’ve got your table, here’s what to do with it.
Look at the first column, Page URL. You’ll see that some pages have been categorized as “evergreen,” “rising,” or “(needs) attention.”
Evergreen articles are your most reliable ones. They have stable revenue year-round.
- Add links to them to pass traffic to newer or underperforming articles.
- Keep them fresh with light quarterly updates: current prices, seasonal tips, possibly new links. Don’t rewrite them from scratch.
- Periodically audit your affiliate placements: test new offers, update outdated links, and experiment with CTA positions.
Rising stars are gaining revenue from month to month. They probably haven’t peaked yet, so act before they do.
- Add affiliate depth ASAP: comparison widgets, booking CTAs, and product links.
- If an article is taking off, think about what makes it work (the topic, the format, the offers?) and write more content in the same vein.
Articles that need attention require a quick diagnosis first. Is the page still ranking but not converting, or has it lost its rankings entirely?
- If it’s still ranking, start with monetization. Broken or missing affiliate links are the most common reason revenue drops. Replace outdated offers with your current top-sellers for those destinations.
- If it’s not ranking, you may be competing in a too-crowded niche, or your SEO may be off. Review your keywords and E-E-A-T signals and see if the post has weaknesses.
ℹ️ A general tip: in cases like this, if you don’t have a ready-made prompt, you don’t even need to write one! Just describe what you need to AI and ask for a prompt.
Tip 3: Dig into specific bookings
Your Bookings report is a powerful starting point. Among other things, it can tell you which affiliate programs bring you the most orders and earnings.
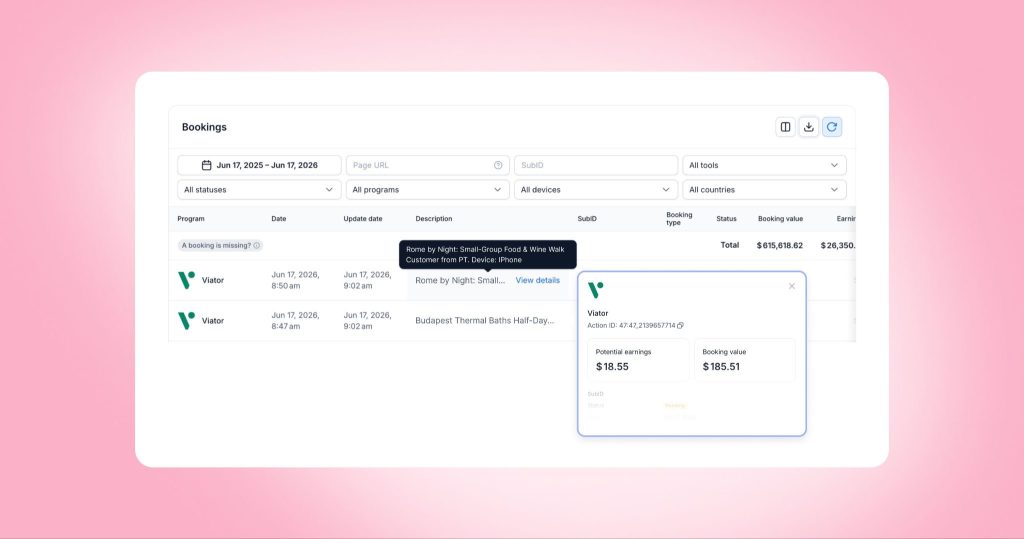
But sometimes, you may want to find out more about specific sales. To do so, just hover over any row in the report, find the Description field, and click View details. You’ll get a full booking card showing details like customer country, device, referrer page, and earnings history.
Tip 4: Find your top-earning offers
Your Bookings report shows your totals per program, but if you go one level deeper, you can find out which offers are actually driving revenue.
Again, this is a task for AI, and our partnerships manager Alexandra has a readymade prompt for you.
Step 1: Download your data
Go to your Bookings report, select the desired period, filter by one program (your top-earning brand is the best place to start), and download the file as a CSV.
Step 2: Prep your data in Google Sheets
Upload your CSV to Google Sheets. Add a “Total commission” column with =total_profit + bookings_pending_profit, and filter out bookings with status “cancelled” in the action_state column.
Step 3: Let AI do the work
Method 1: In Google Sheets, click the Gemini button, select Analyze Data, and paste a prompt like this:
Show me the top 5 products by total commission and top 5 by number of bookings.
You’ll get a ranked breakdown in seconds, no formulas needed.
Method 2: You can also upload your CSV to ChatGPT or Claude and ask the same thing.
I have a CSV with affiliate booking data. Please analyze it and show me:
1. Top 15 products by number of bookings — table with: product name, number of bookings
2. Top 15 products by total commission — bar chart with: product name, total commission
Notes:
– Extract product name from the description column — take everything before “. Customer from”
– Total commission = total_profit + bookings_pending_profit
– Exclude cancelled bookings (action_state = “cancelled”)
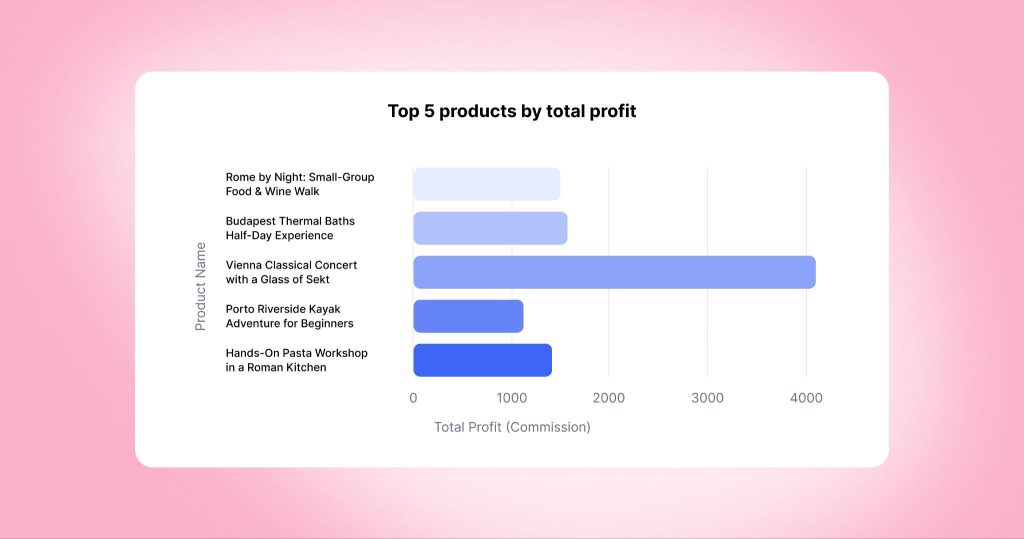

Hello! I’m Alexandra, and I love using data to help travel creators earn more. Now that you know which products your readers book, here’s what you can do with that info.
- Scale your top performers. Place them on more pages, highlight them as “my readers’ top pick,” or make them more prominent within existing articles to drive more clicks.
- Cut what doesn’t convert. Remove or deprioritize offers that consistently underperform. Focus your placements on what sells.
- Use this data in brand conversations. If a specific hotel or tour is selling well, you have numbers to back up a conversation about paid placements or sponsored opportunities.
- Let the data inspire new content. Boat tours converting well? Write a dedicated piece about them. Your booking data is one of the best content briefs you have.
Your blog analytics can tell you so much – all it takes is a few minutes of your time. And now that you have some data-informed next steps, get to them!