
Changes to Reporting
The new design of reports was rolled out in September, but the old interface will still be available until the end of the year. At the end of the year, data over three years old will be deleted. Make sure to download your data while there’s still time.
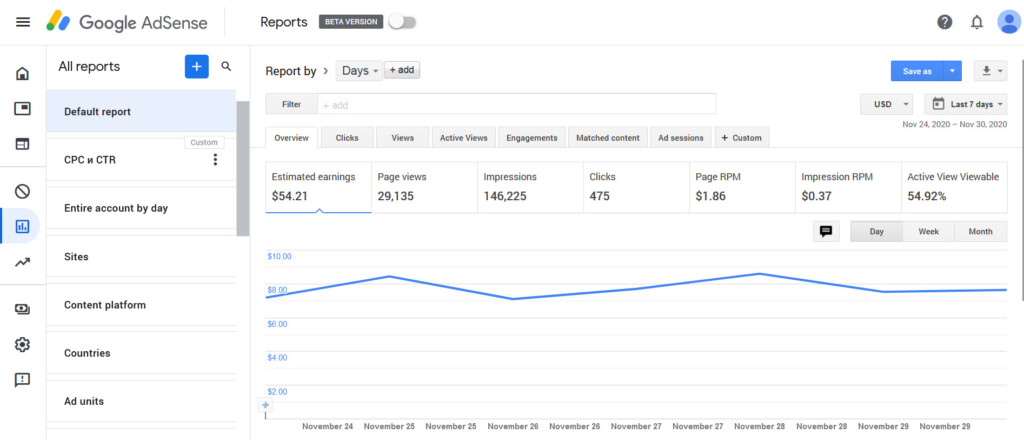
Before
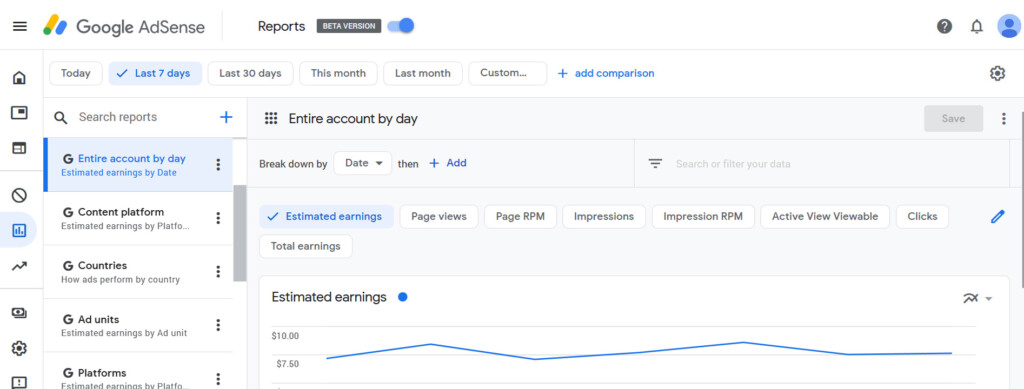
After
What’s New
- Simpler use. The interface was redesigned to make it easier to access important metrics.
- Easier to visualize. Diagrams and graphs are now more closely integrated with the table.
- Better experience on smartphones. The new dashboard is well-optimized for mobile devices with small screen resolutions.
- More supportive. The interface now has more information for major metrics. When hovering over an icon, you’ll see an explanation of each metric.
If you’ve only been using AdSense for a couple of months, you won’t notice major changes in the interface. However, webmasters who have been monetising their sites through the network for some time will have to get used to the new design.
Those who earn a regular income on AdSense will have to master the new dashboard, as the old version is only available till January 2021.
Major Changes
- Limited storage time of data. Reporting data will only be available for the last three years. Older statistics will be deleted.
- Removal of YouTube and Admob data. Reporting information on monetized YouTube channels will no longer be available in AdSense. You can now find this information in YouTube Analytics.
- New design. Reports in the dashboard now look more sophisticated and have a new structure: some tools might be harder to find.
- New features. You can quickly combine data for several metrics in one graph, add notes, switch between data ranges, and set up the order of tabs in the left-side menu.
If you download a table with outdated data from AdSense and check the indicators, you’ll see that most major metrics remained in place:
- Projected revenues
- Page views
- Impressions
- Revenue per 1,000 impressions
- Impressions above the fold
- Number of clicks
How to Use the New Dashboard
Google partially took care of publishers and added the option to automatically transfer reports created with the old version to the new one as scheduled. Saved reports can only be transferred manually.
Drag & Drop in Reports
One of the new interface features offers the opportunity to change the order of elements in the sidebar. You can customize it for your convenience and access important reports fast.
For example, if you want the “Sites” report to be first, hover over it, drag up, and drop. The block will show up first the next time you open the report.
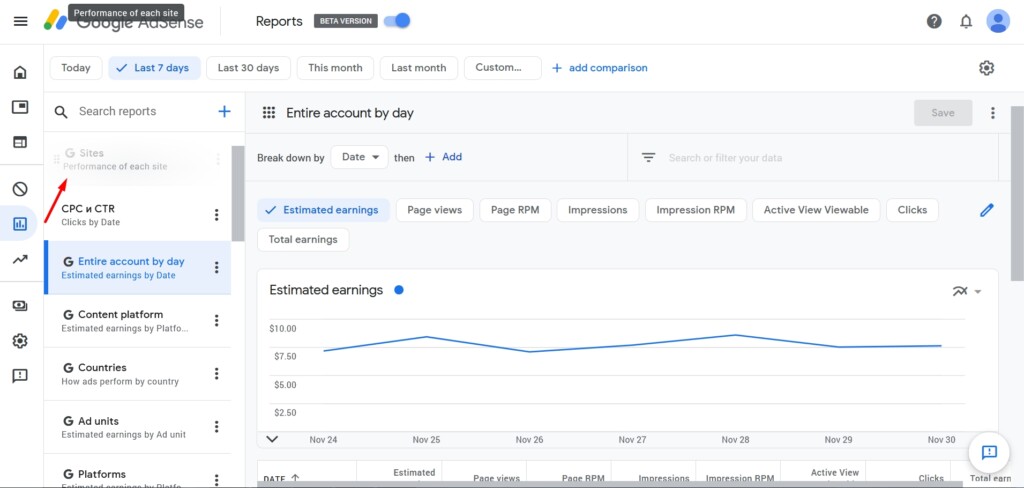
Similarly, you can drag any tabs and push irrelevant ones down the list.
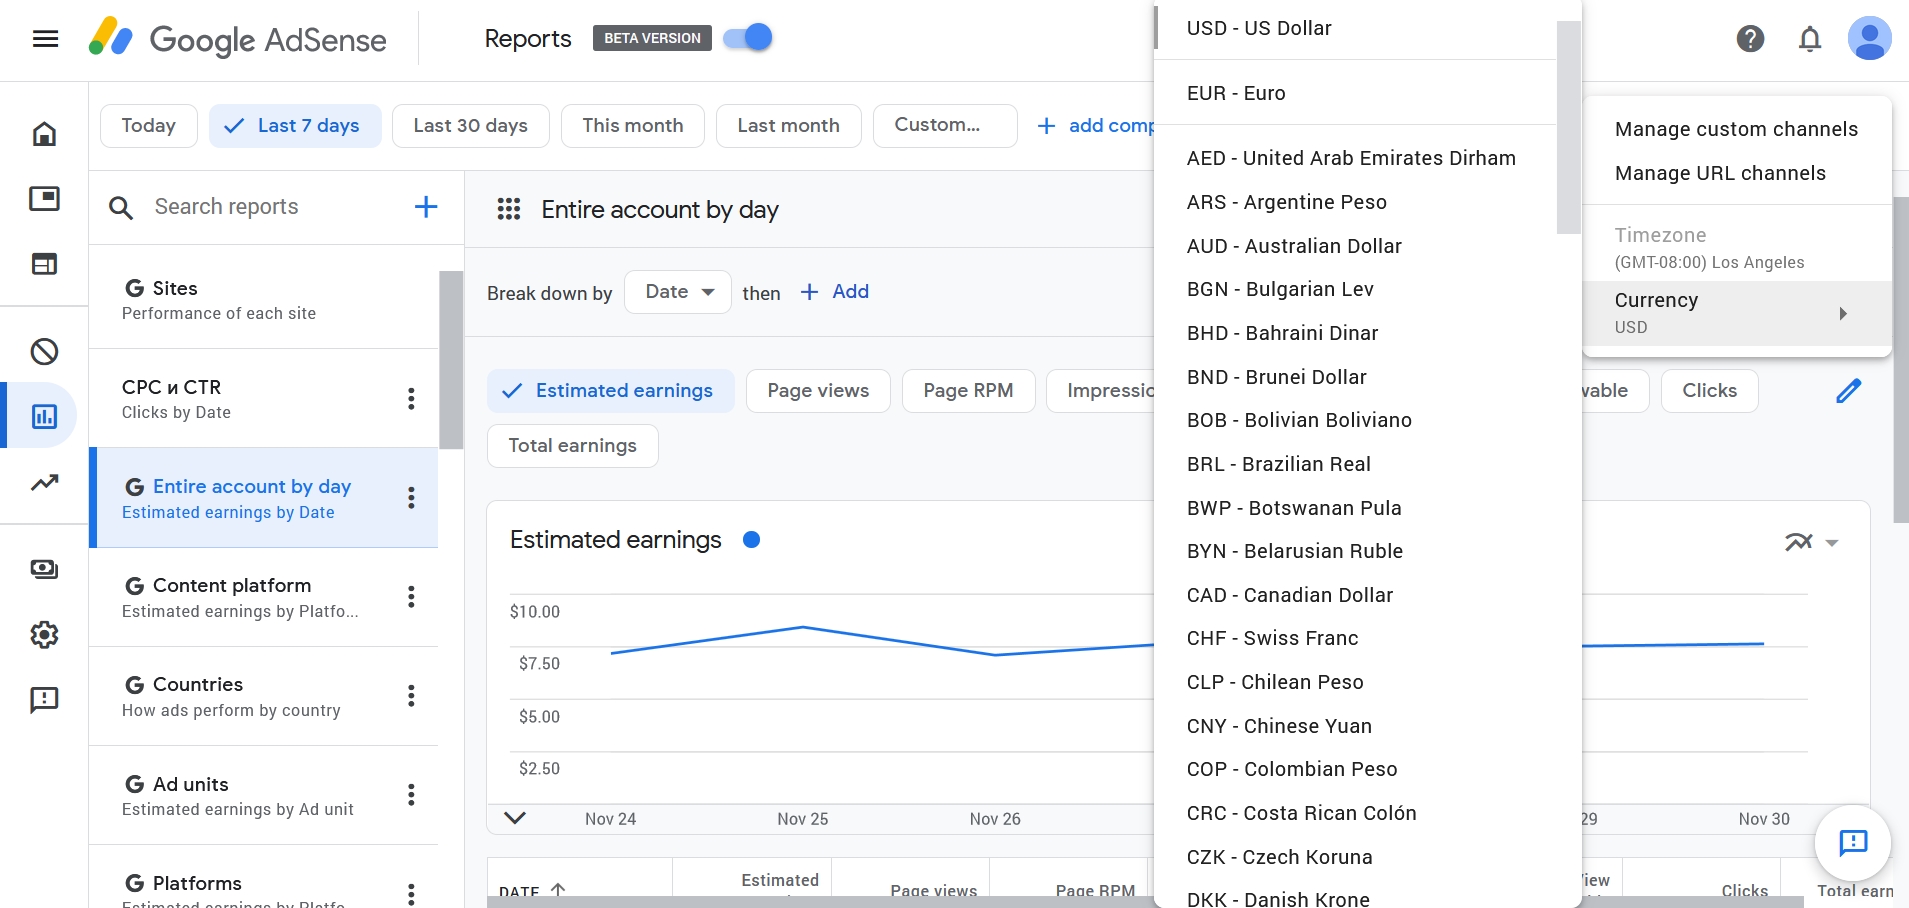
Switching Currency
In the old interface, the dropdown list with currency choices was in a visible spot, close to the date range. In the new interface, this list is harder to find, especially if you are not actively seeking it out.
How to change the currency:
- Select any report.
- Click the gear icon at the top of the screen.
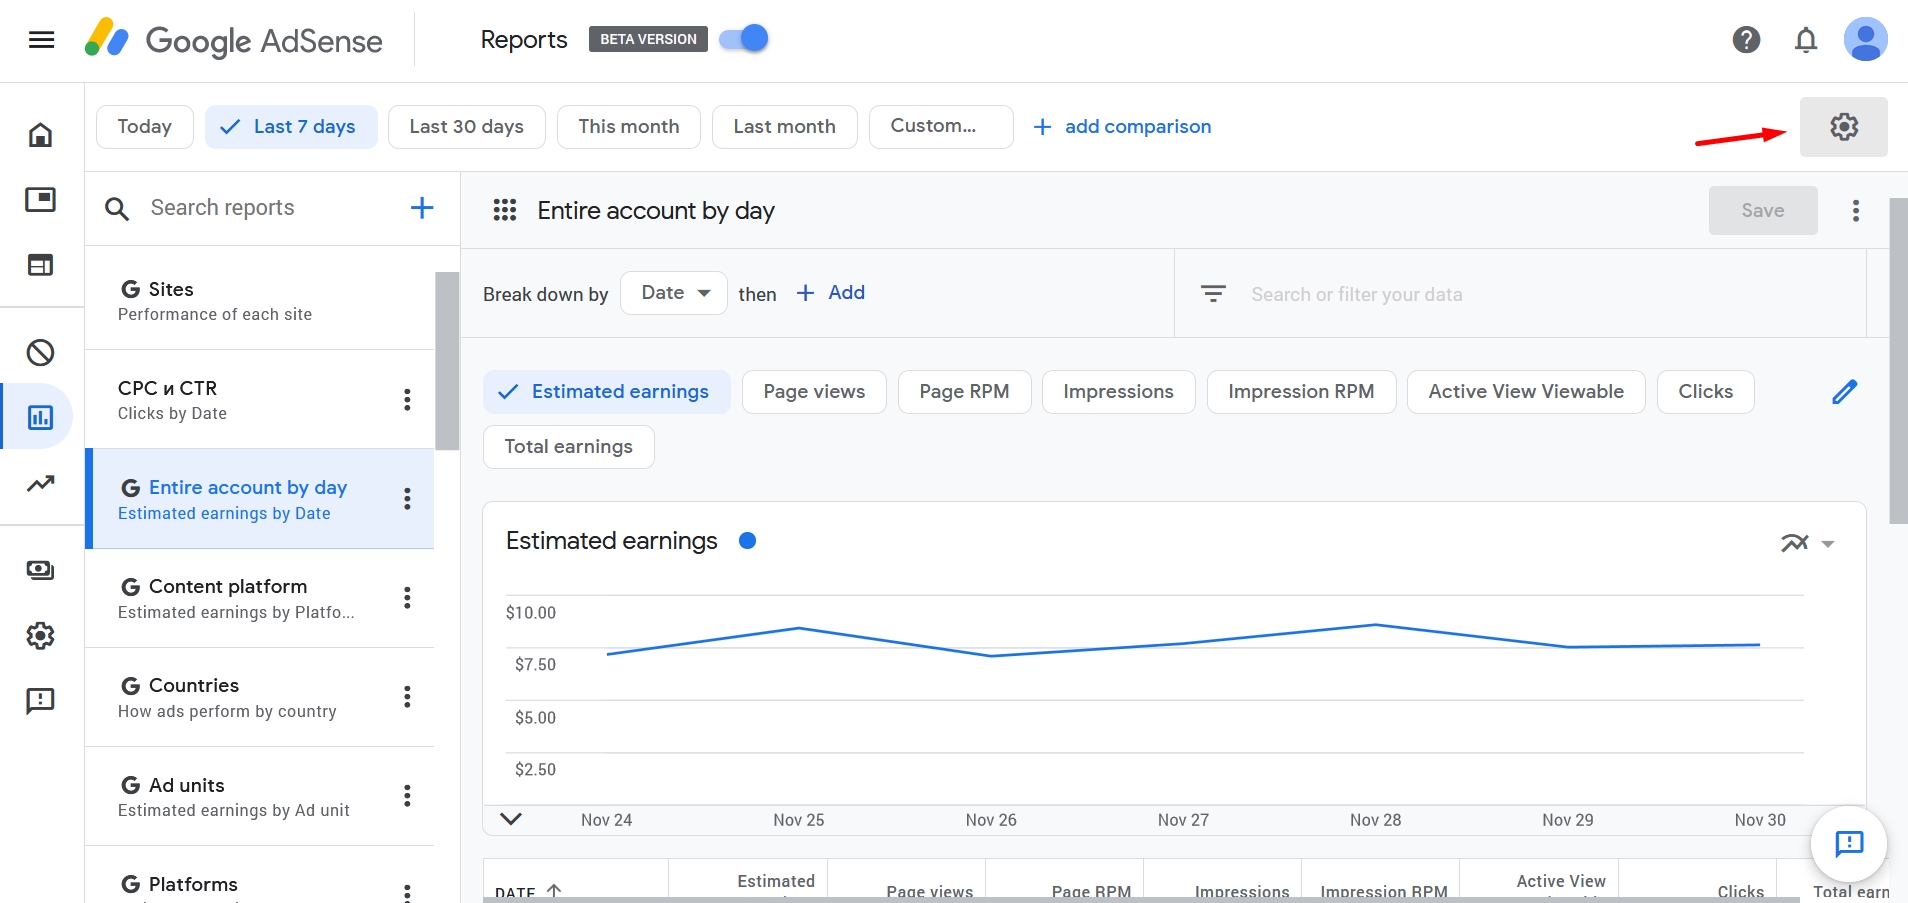
- Select a currency.
Useful Life Hacks
AdSense’s reporting structure is very convenient, but you can always improve the experience if you know how to take advantage of hidden tools.
Adding Ctr and CPC
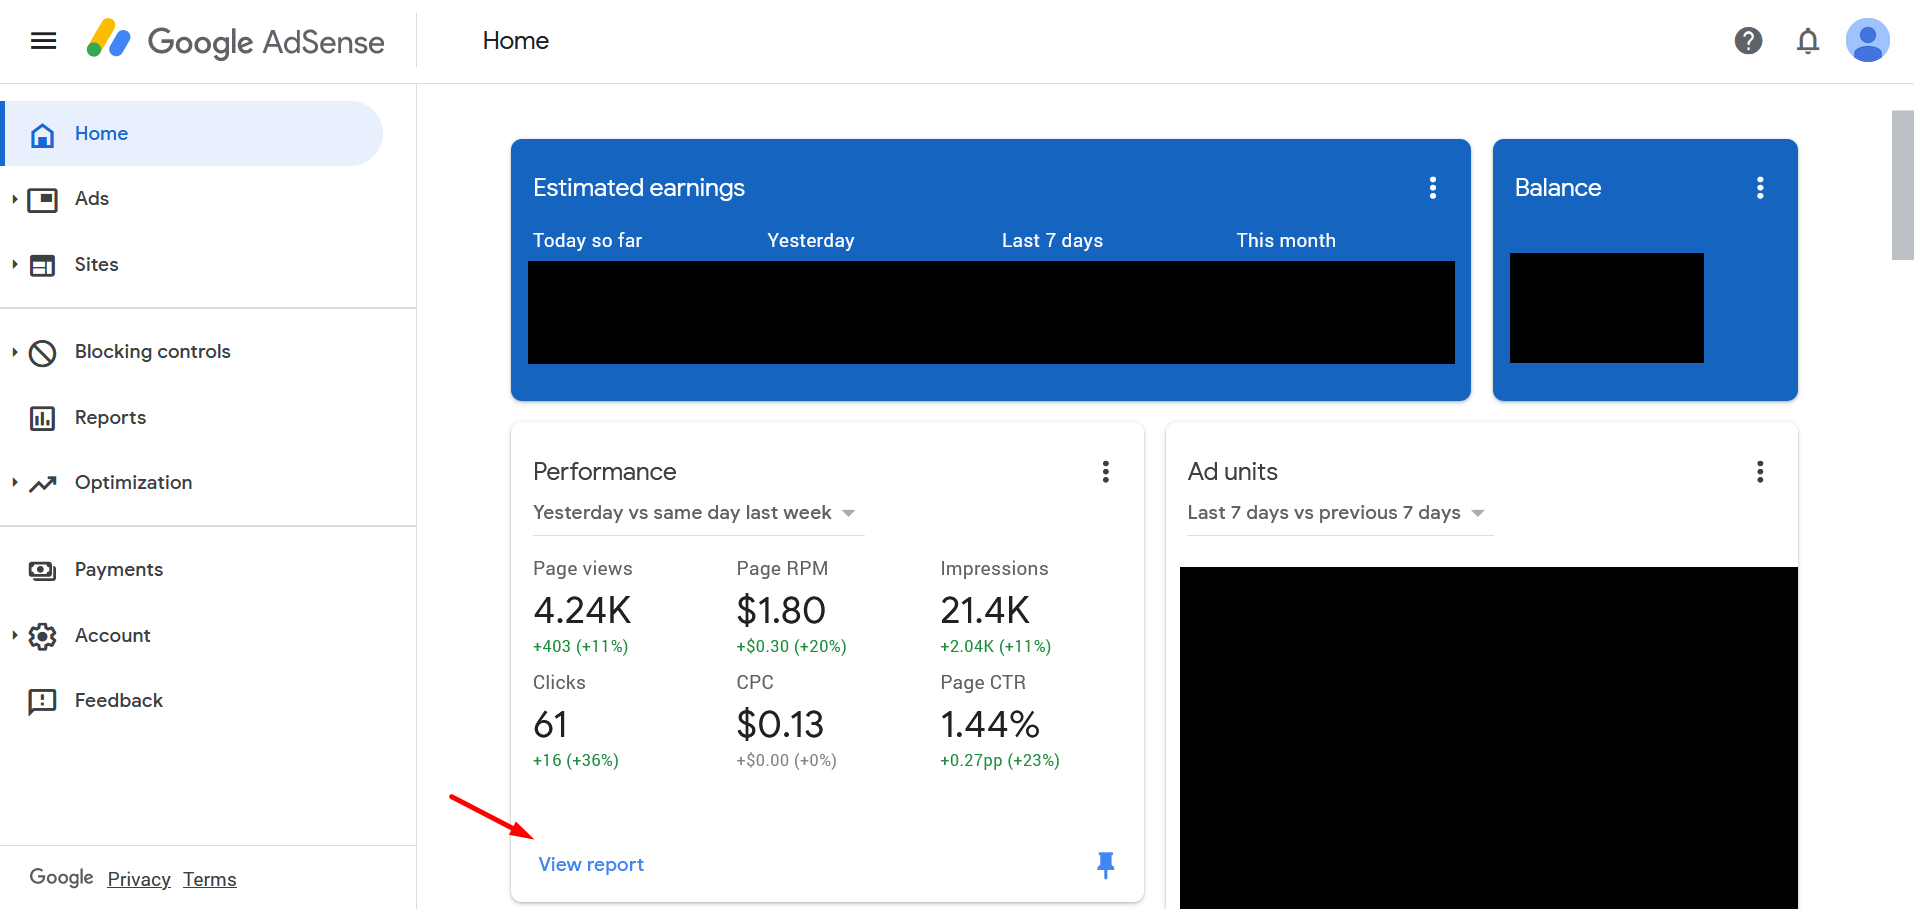
On the AdSense homepage, you can find the “Efficiency” widget, which provides data on site monetization for yesterday, last week, last month, and the three previous months. This widget displays statistics based on the cost per click (CPC) and click-through rates (CTR) of ads.
These indicators show monetization efficiency. The dashboard doesn’t have such metrics by default, but you can add them manually.
Step-by-step guide:
- Click the “View report” button on the “Performance” widget on the homepage.
- Specify your data range if necessary.
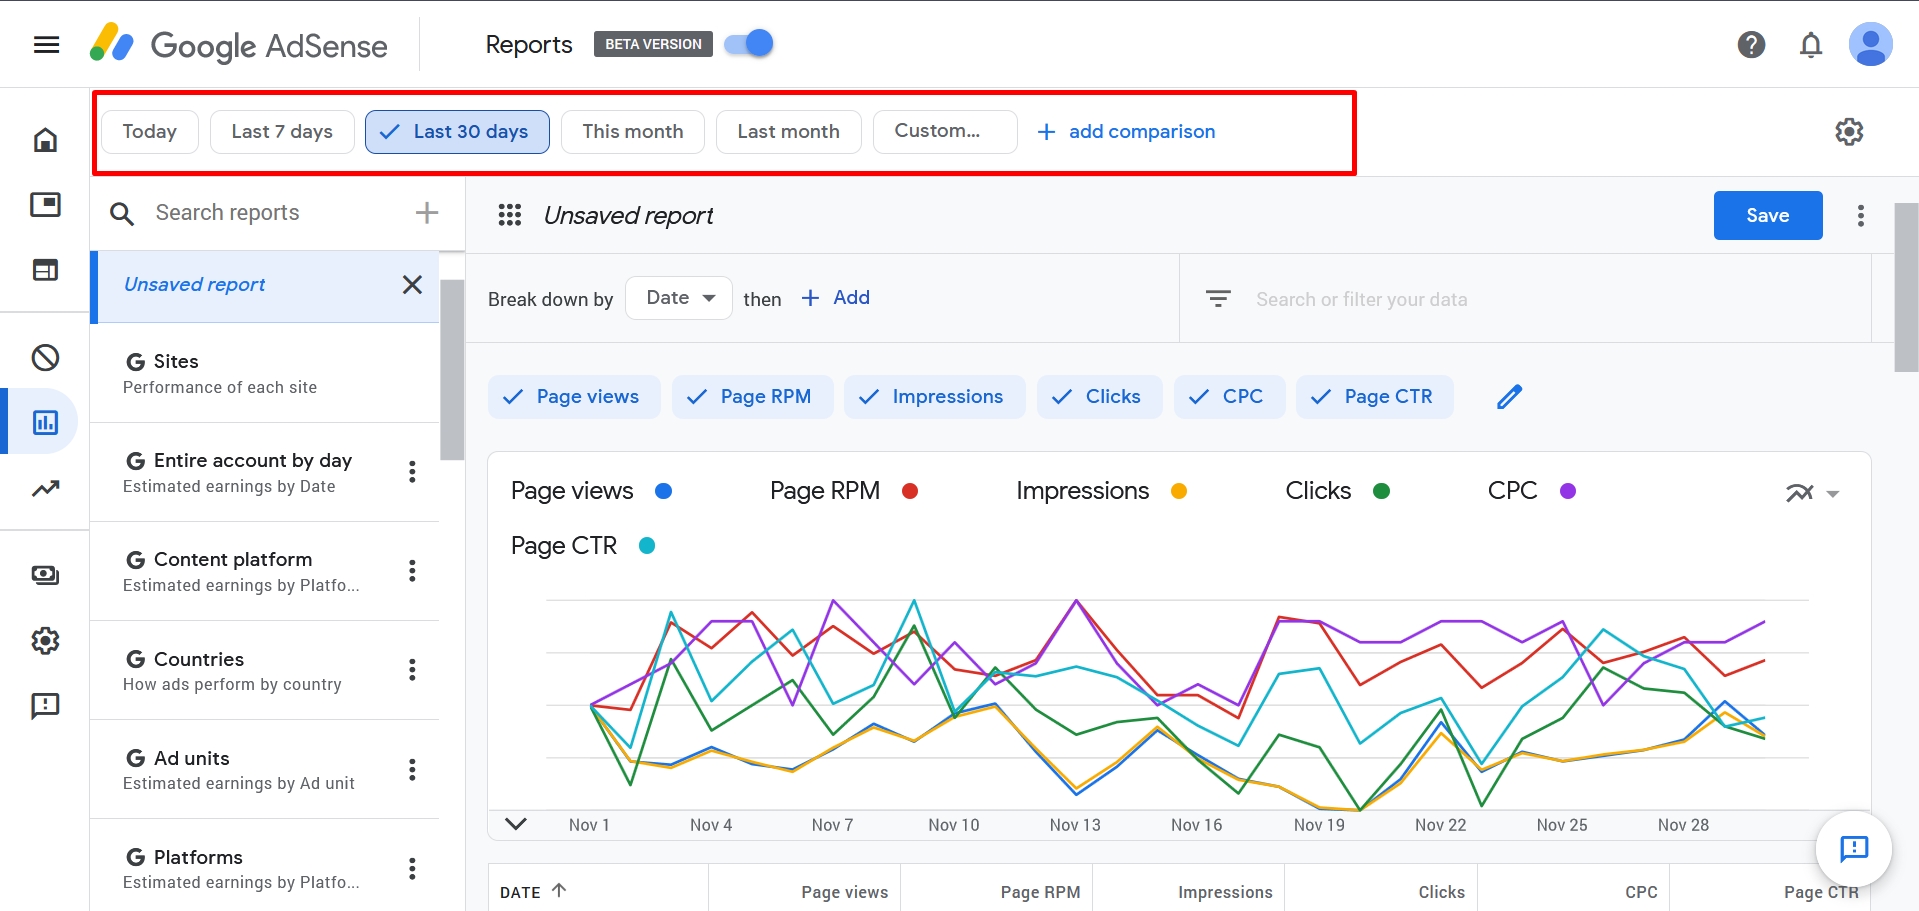
- Remove unnecessary metrics.
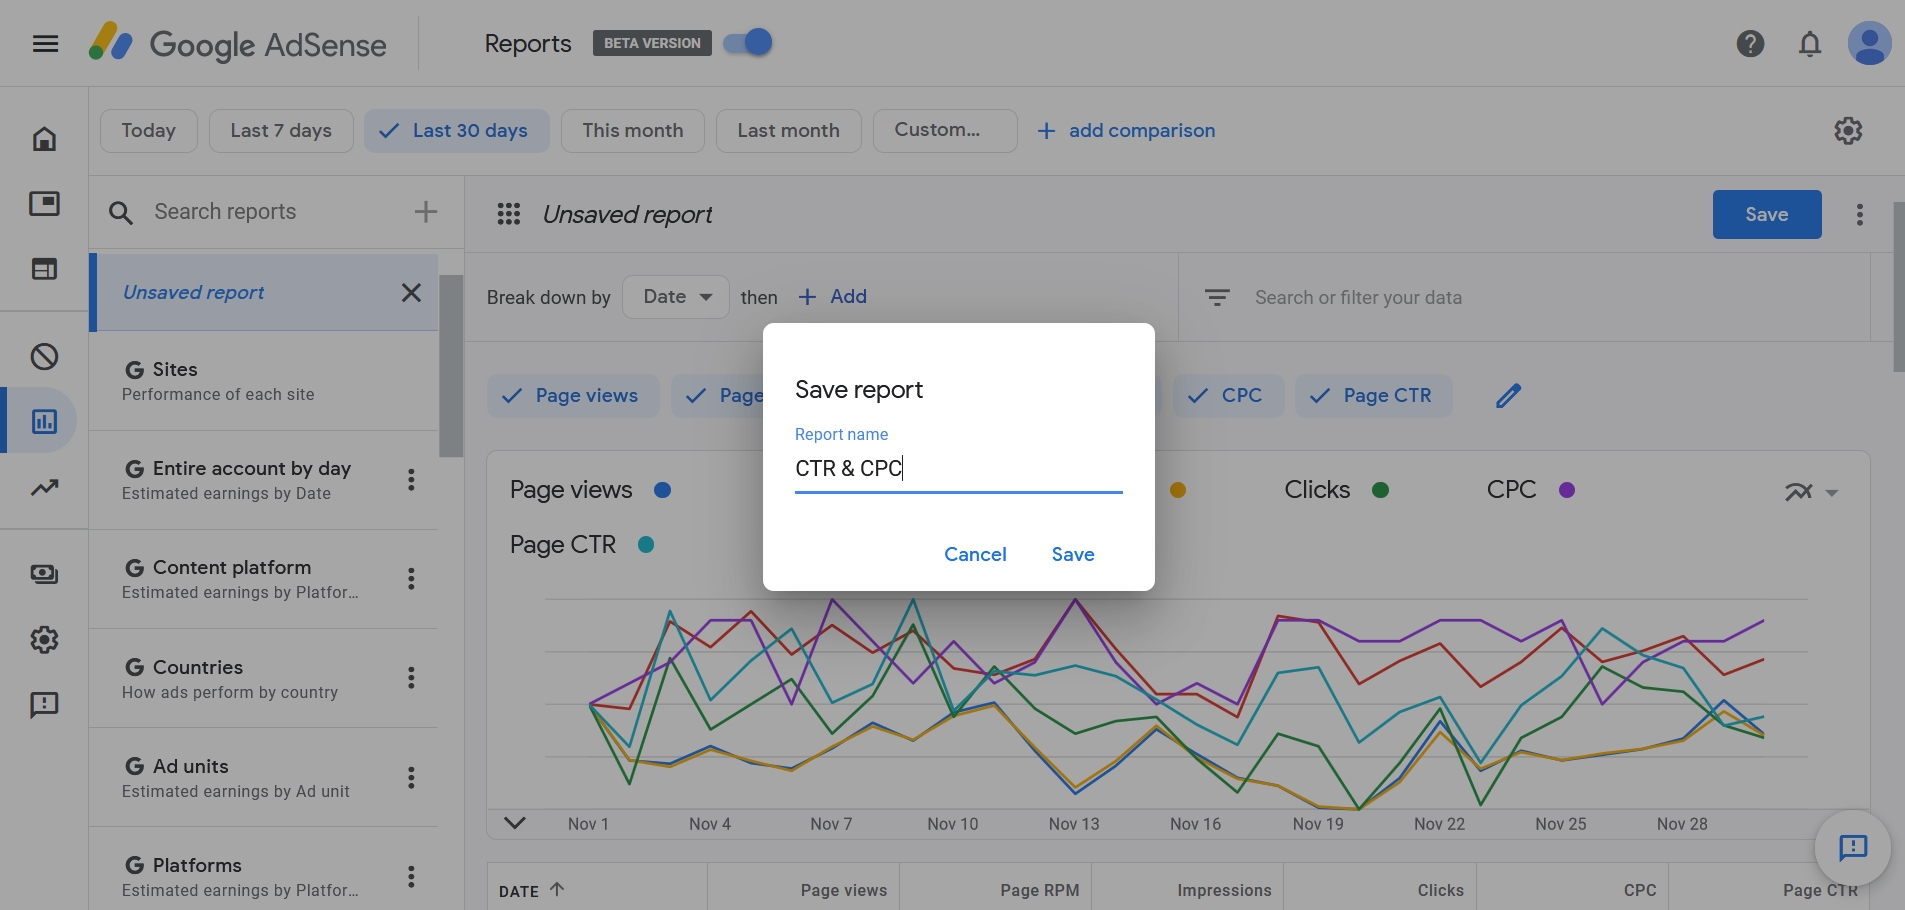
- Click “Save.”
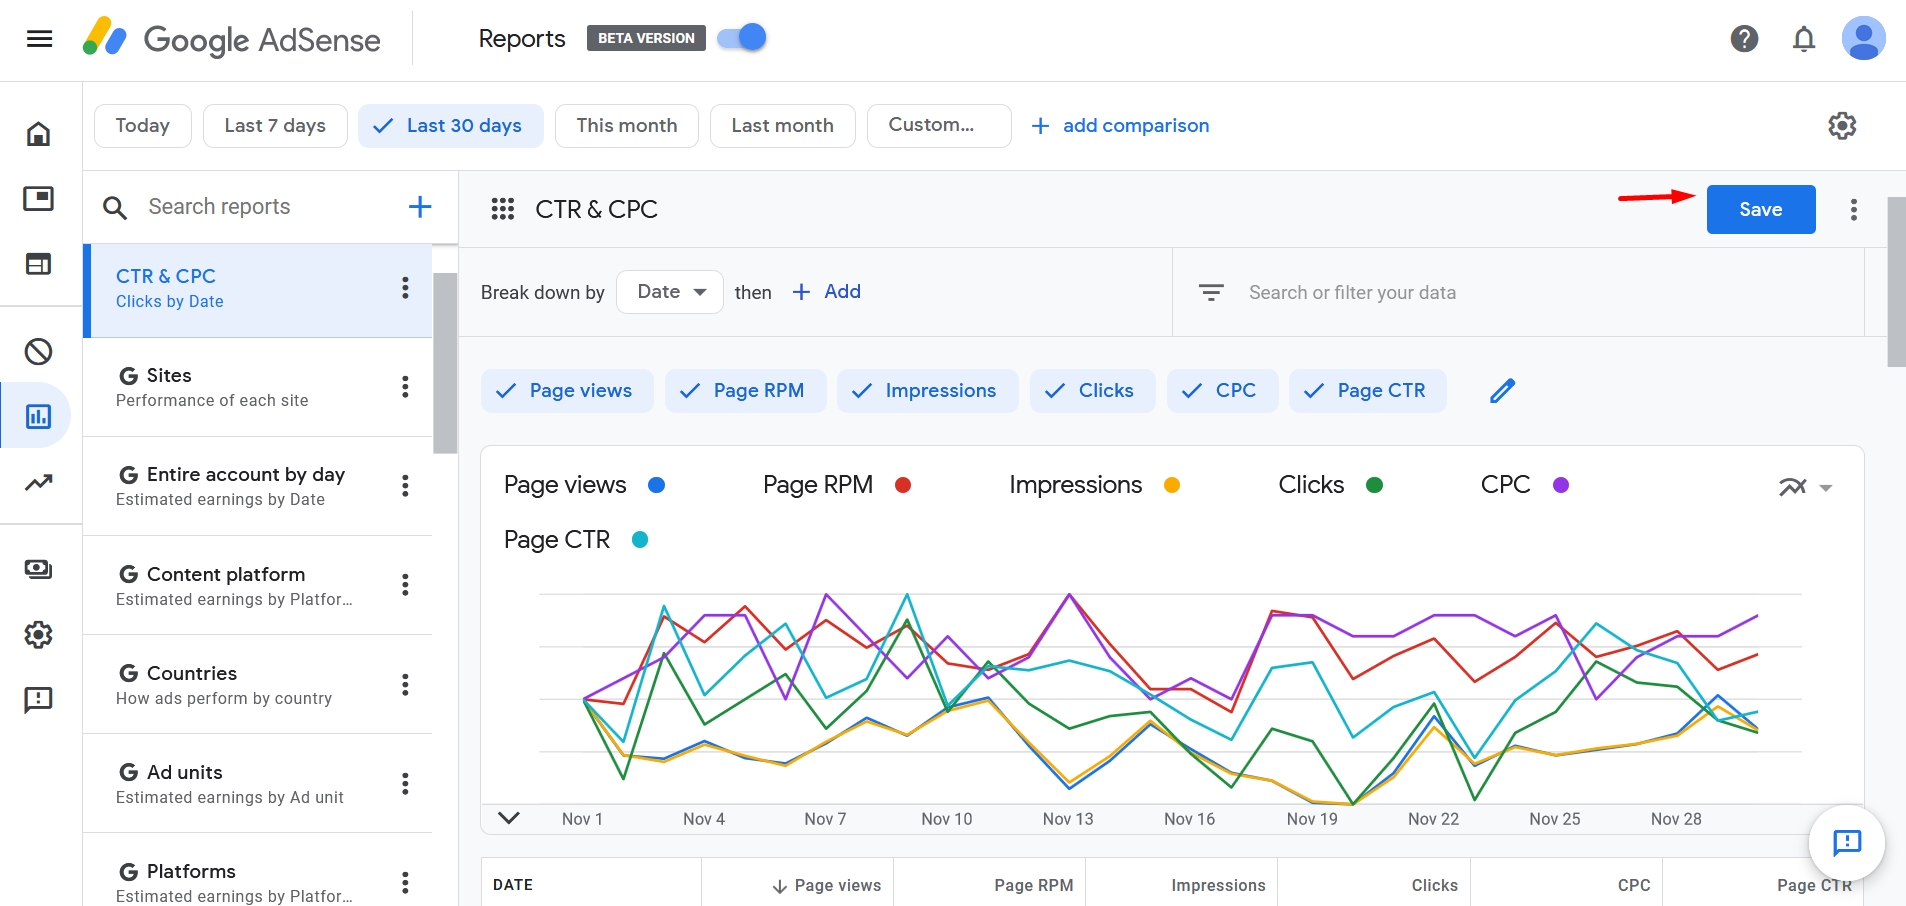
- Enter the name.
Apart from CTR and CPC, you can add data about the cost per 1,000 impressions, number of impressions, and clicks. If you want to track the number of clicks and CTR in different reports, leave only one indicator in Step 3 and save the report.
Scheduling Reports
To catch critical problems in time, be sure to constantly monitor your essential metrics. Comparison with previous periods clearly illustrates the dynamic. For example, some niches see a decline in revenue per 1,000 impressions and CPC after the New Year holidays.
Also, Google has a double click penalty, which manifests as a huge drop in the number of click outs on ads, while impressions remain at the same level. If a webmaster constantly monitors the numbers, it helps get rid of this filter faster. Scheduling reports also allows you to rapidly receive data on monetization efficiency.
Here’s how to set it up:
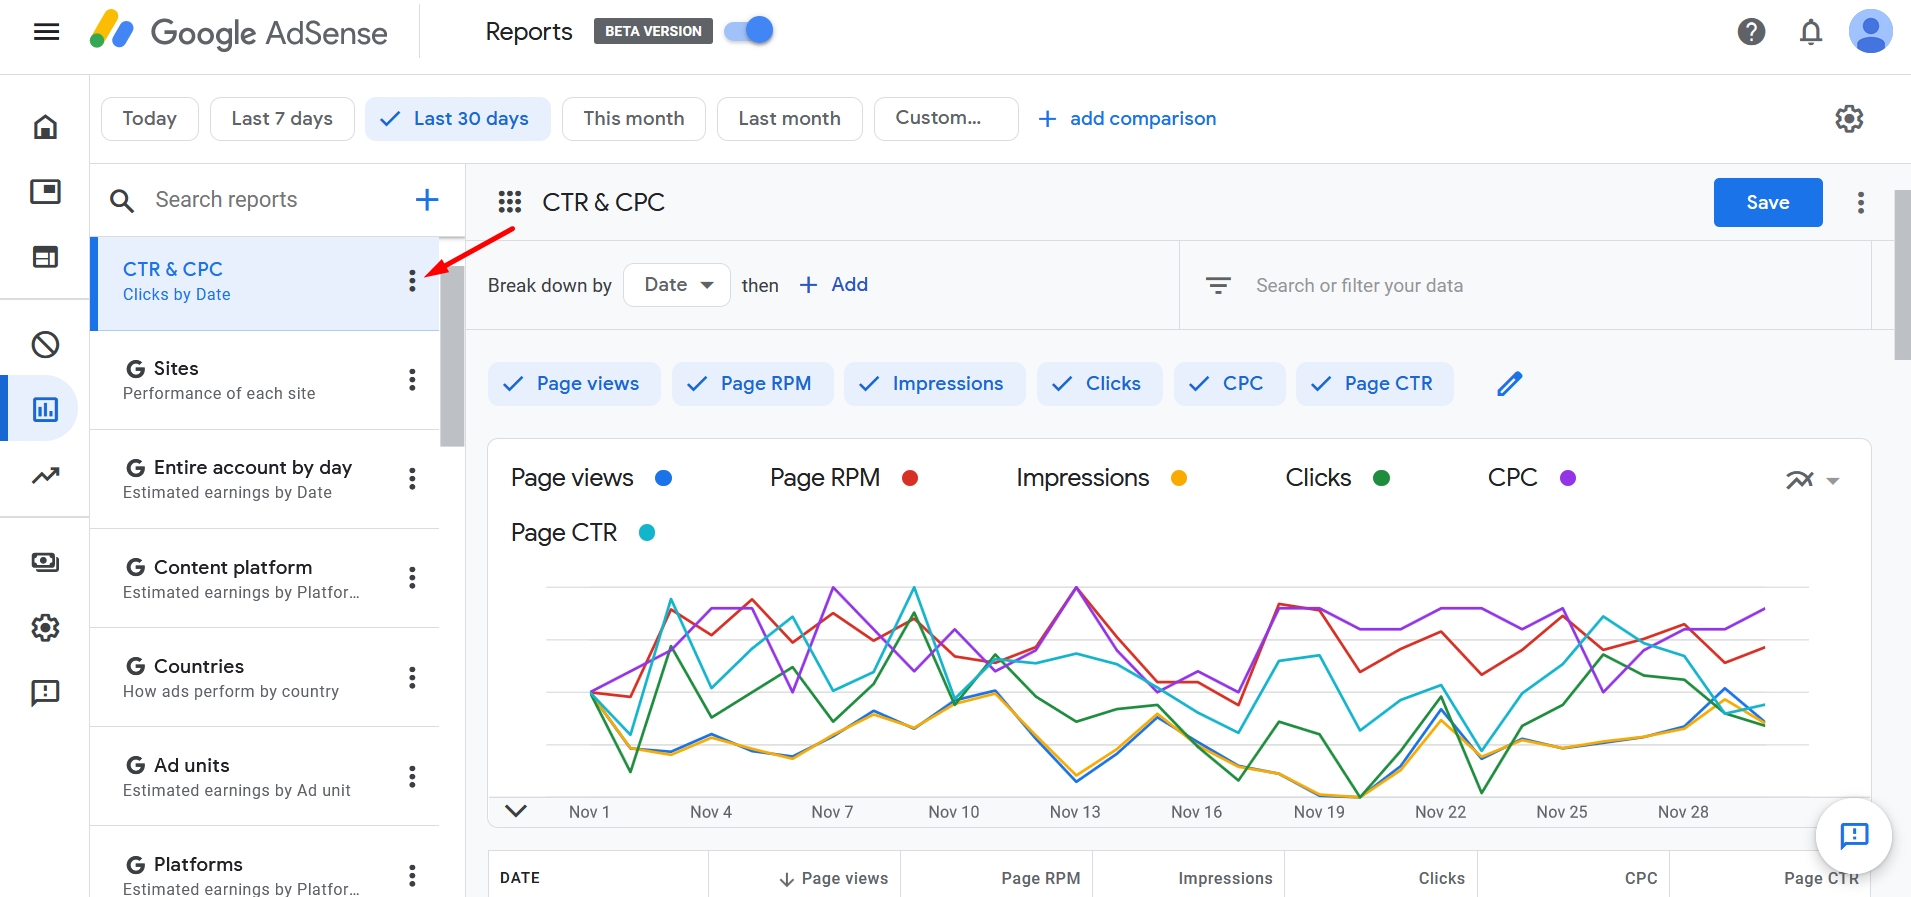
- Create a nonstandard report.
- Click the icon with three dots next to the widget name.
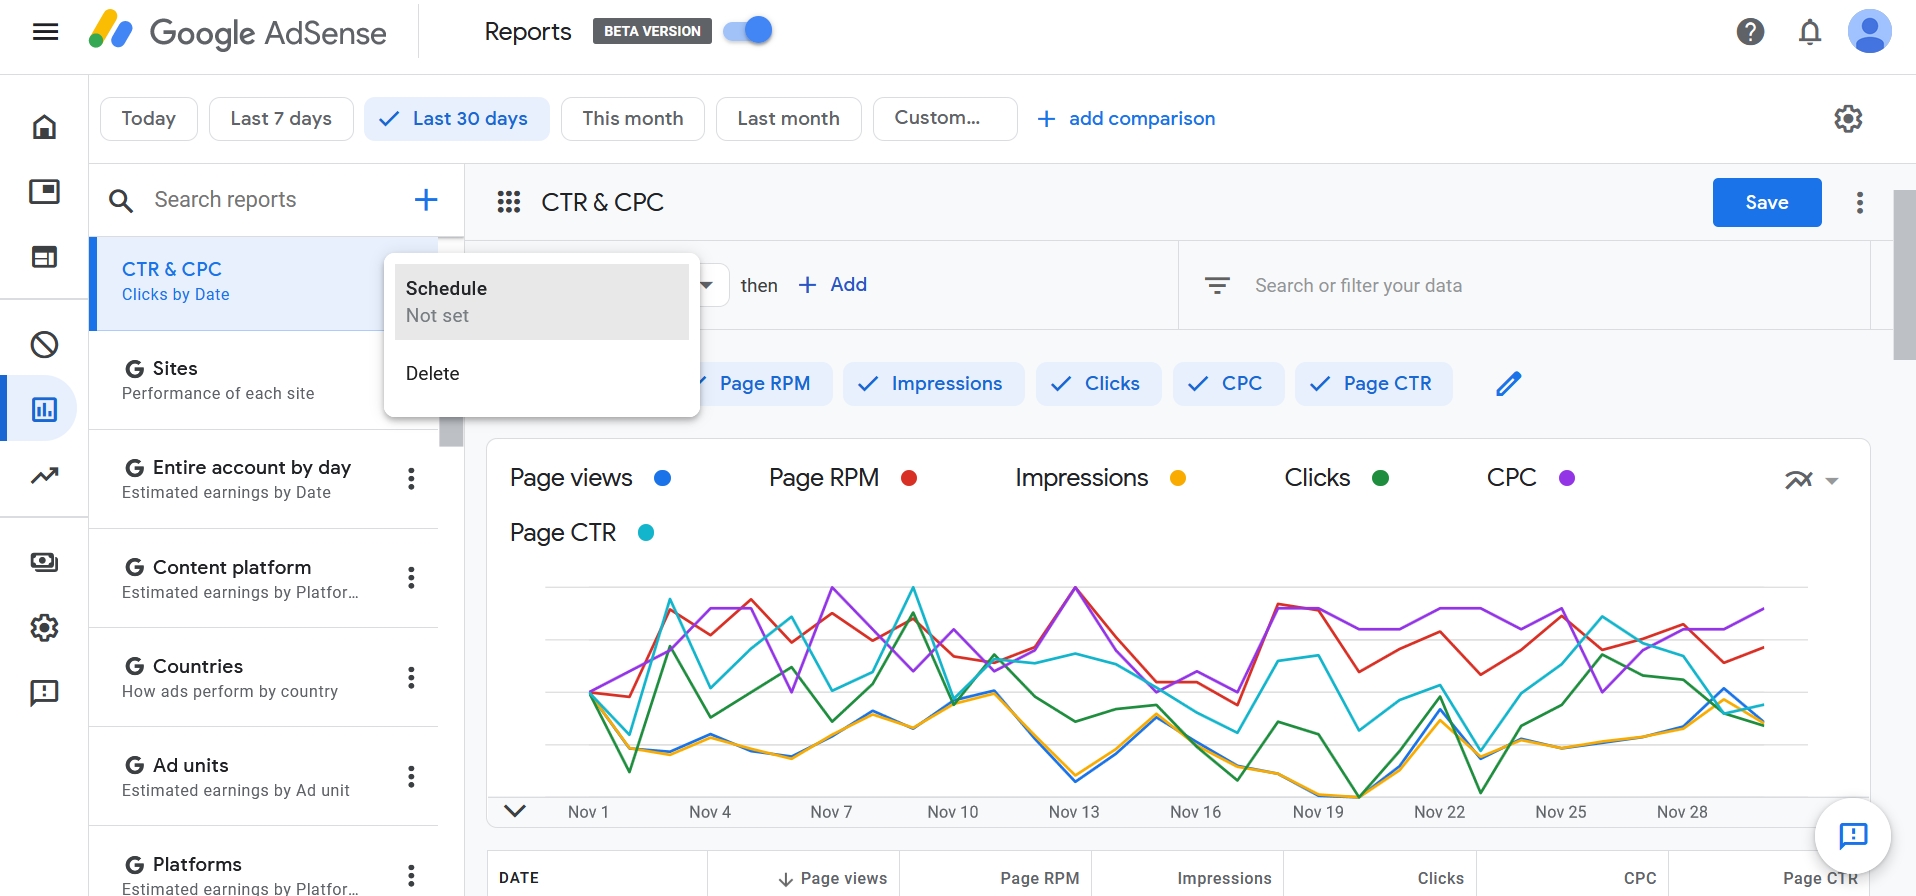
- Select the “Schedule” menu item.
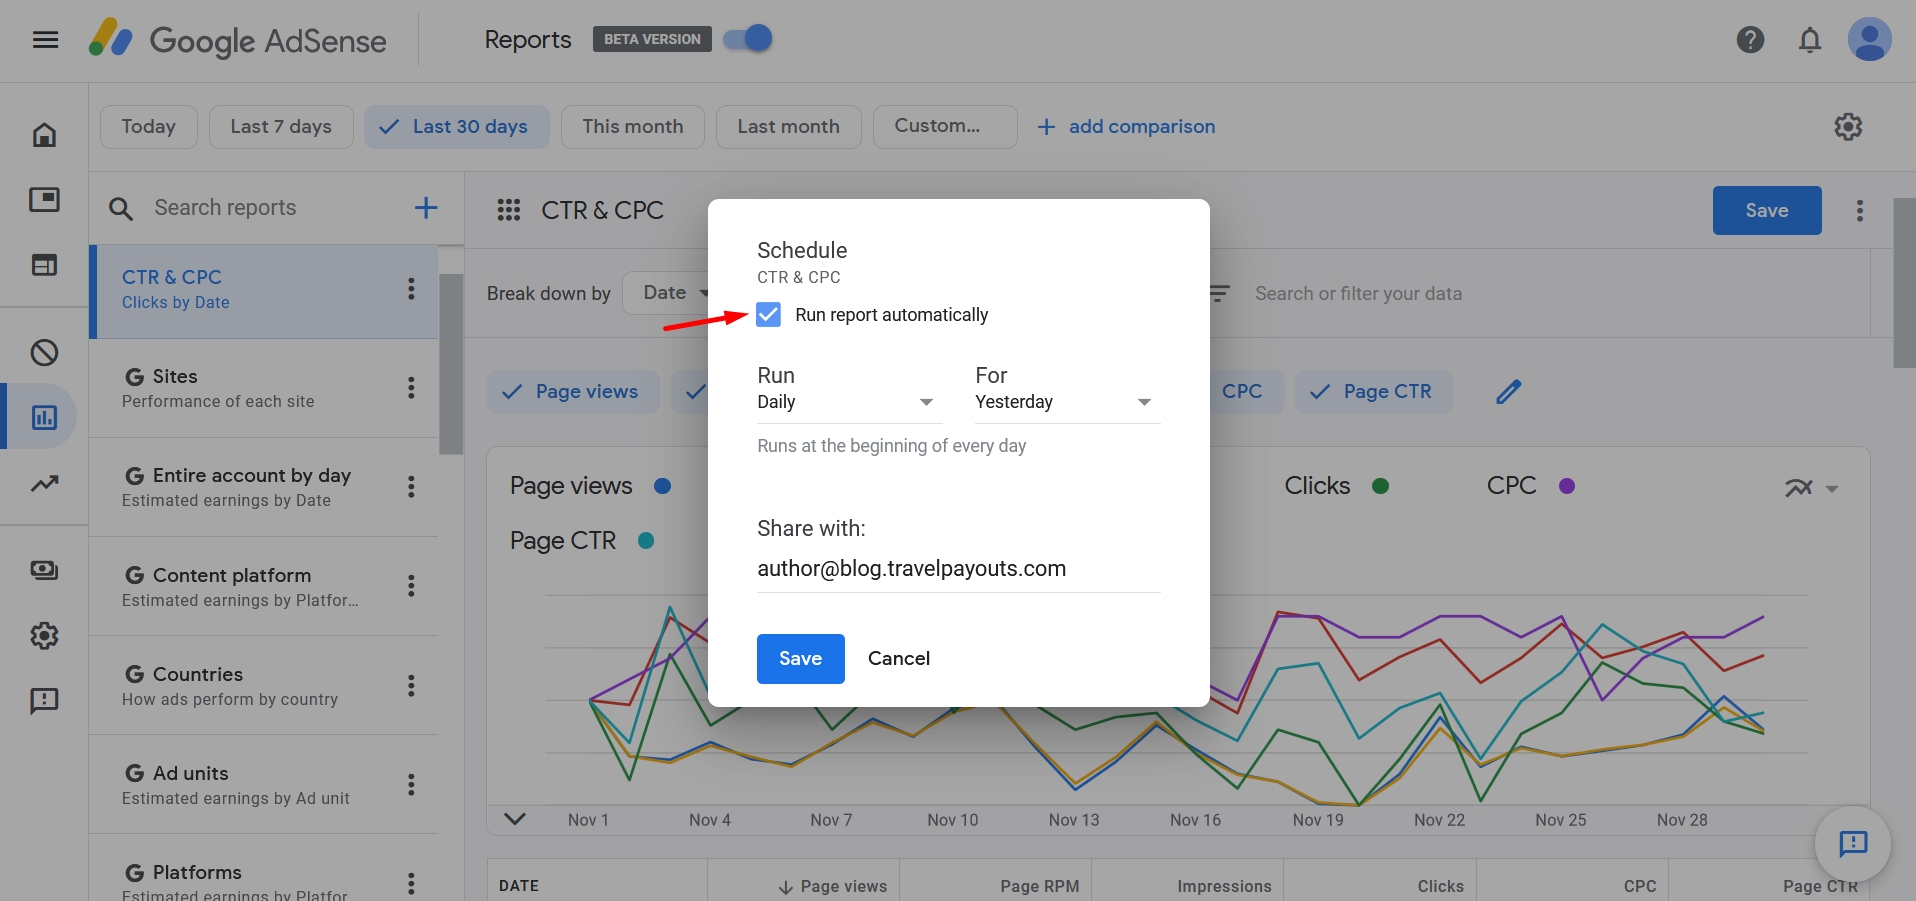
- Click “Run report automatically” and set up the mailing frequency.
How to Access Old Reports
If you don’t like the new interface or need to access data older than three years, you can still use the old dashboard. To save your numbers on site and use reports later, be sure to download your old reports as soon as possible.
There are three ways to go about this:
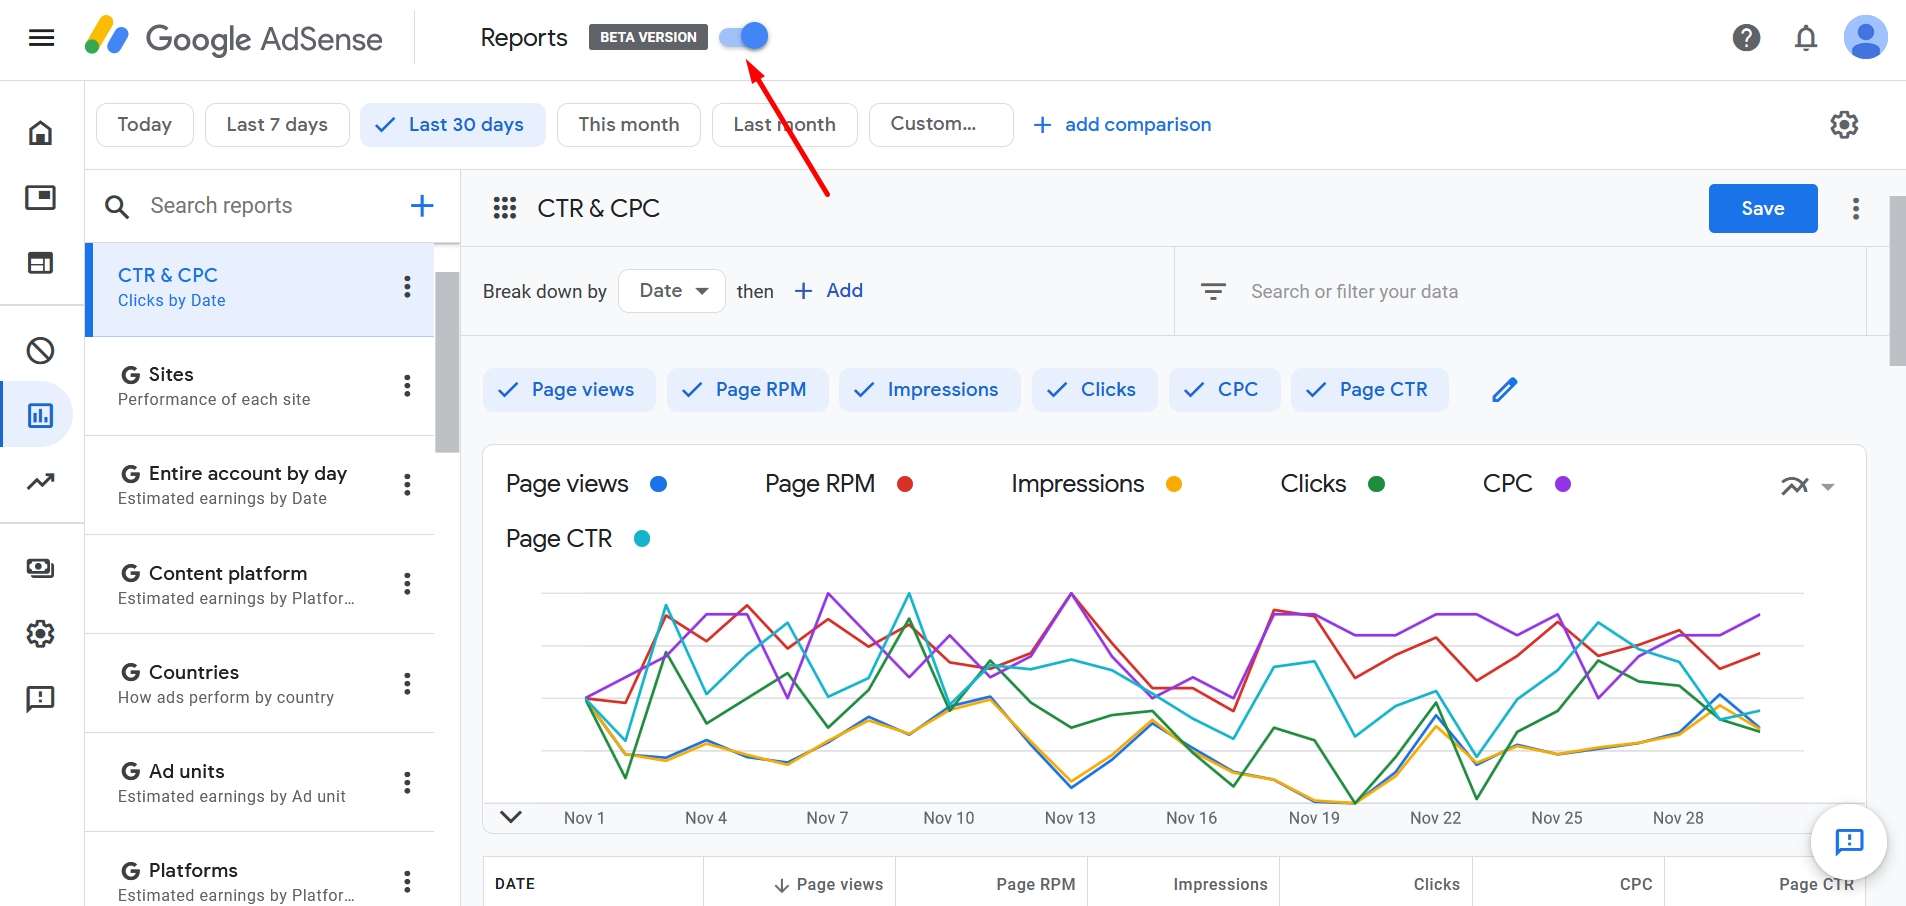
- Open the old dashboard. Click the switch at the top of the screen. The page will refresh and you’ll see the old reporting interface.
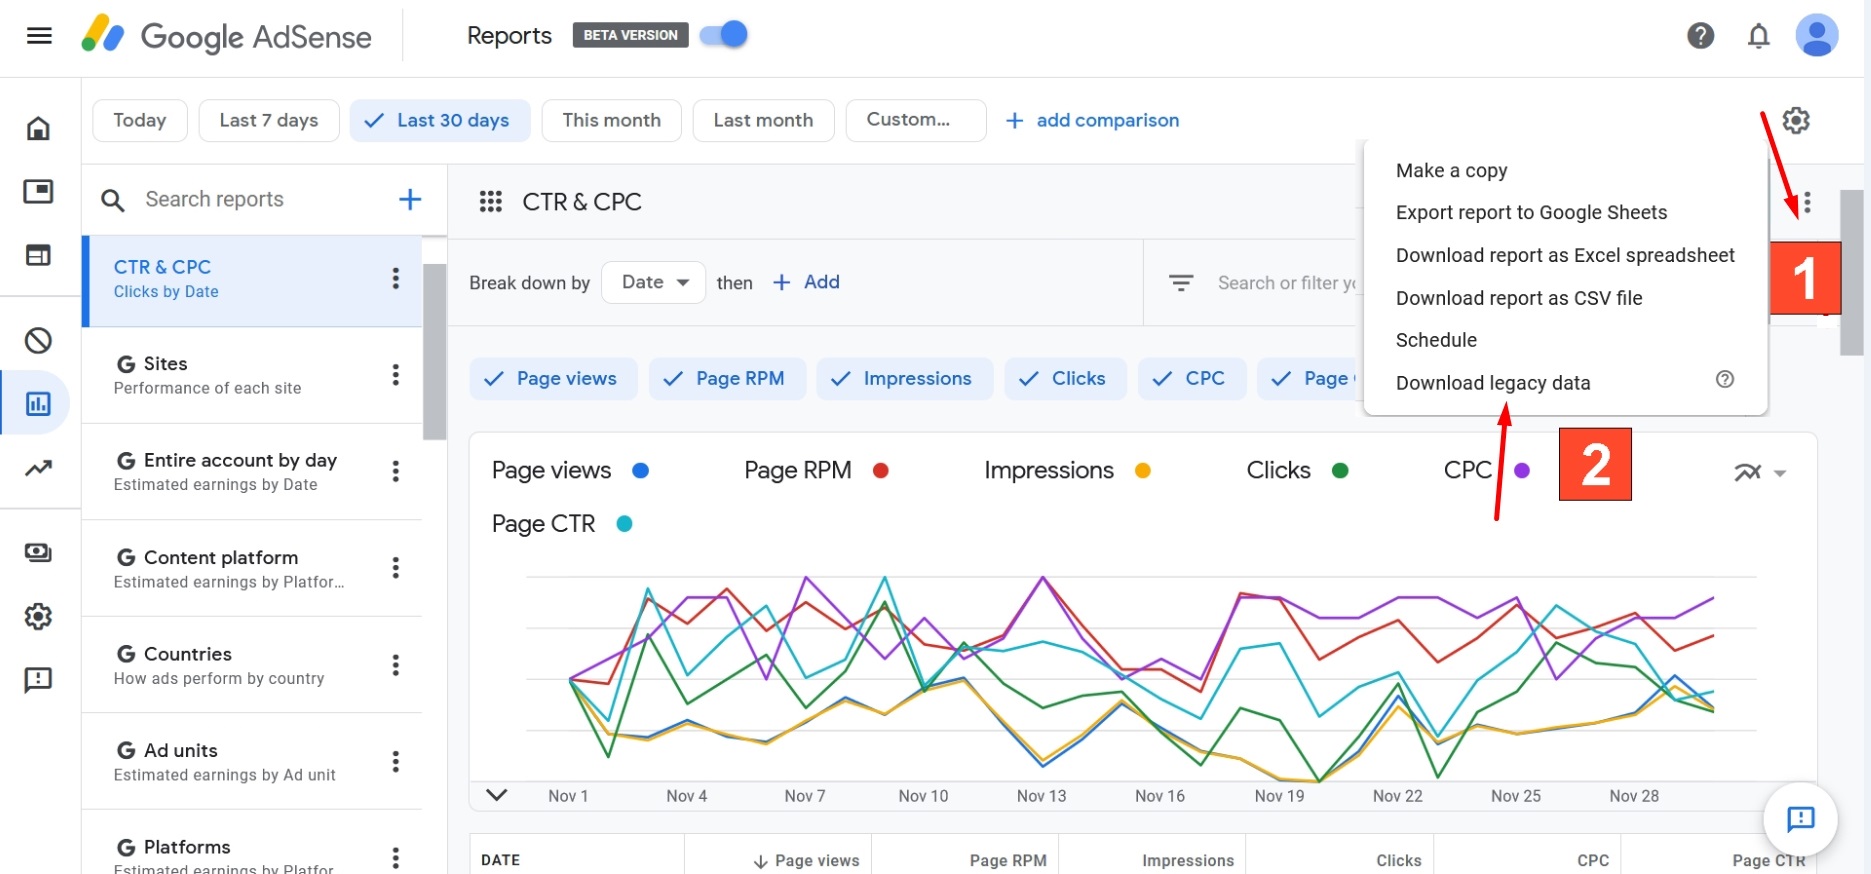
- Download missing data. Select any report in the new interface, click the icon with three dots and then the “Download legacy data” button.
- Use the migration tool. Open the tab with reports in the new dashboard, click “Transfer old reports,” select specific elements, and confirm the operation by clicking the “Transfer” button.
Changes in the Google AdSense reporting dashboard came suddenly for webmasters who monetize their sites with content. It was especially surprising that data from three years ago and older will be removed from the interface. However, it’s beneficial that Google gave users some time to transfer important information by sending out email notifications about the upcoming changes.
Don’t forget that besides AdSense, there are many more ways to monetize a travel site, which we have written about in detail in our article. And it is always a better idea to use several monetization options, so that the income drawdown for one can be at least partially compensated. This way, you will also be able to adjust your marketing strategy more flexibly to the changing situation.