
Why Do You Need to Analyze Website Traffic
To successfully promote your site in search engines and monetize your website traffic, you should regularly analyze and check a website’s traffic. This will help you find out:
- Resources and search engines that bring readers to your site.
- User demographics— their gender, age, geography, and the like
- Traffic changes depending on the day of the week, holiday, or working day
- The most readable pages
- If the applied promotional tools are useful or not
- What you should do to improve behavioral factors and increase overall traffic?
As a result, you will be able to monitor the effectiveness of online marketing, cut off what does not work, and allocate the budget properly.
What Metrics You Should Check
Remember that to achieve high results, you need to analyze traffic at least once a week. Let’s see what websites traffic statistics you should pay attention to.
Sessions (visits) is the simplest metric that you check first. A visit is any interaction with your site made by the user for a specific period. A session is a group of interactions with a site that occurs during a certain period.
Average visit duration. This indicator shows the average time the user spends on your website. It is the arithmetic average between the visit times of all users. Search results are improved when this rate increases.
Bounce rate. It shows the percentage of users who went to only one page of the resource and left it within 15 seconds.
Channel indicates the type of traffic source, for example, organic search, contextual advertising (CPC), or referral from the website.
Clicks. This metric shows the interaction of users with various elements on the pages of your site.
Conversion indicates the percentage of visitors who have completed the targeted action on the site: made a purchase, called, filled out the lead form, etc.
CTR shows the percentage of users who visited your site after seeing one of your pages in search results. For example, if 10 different users saw your page in search results, but only one clicked on it and went to the site, your CTR would be 10%.
Hits. Hits include views and events. A view is a user download of a page on the site. Web analytics systems log views automatically. An event is a user’s action that does not load a new page but is recorded by the web analytics system (for example, watching a video or clicking a button).
Landing/exit pages. The landing page is the first page that the user sees when entering from a variety of sources and channels. An exit page is a page where the user ends its visit.
Returning visitor is a user who has already set cookies when visiting the site the previous time.
Sales funnel. It reflects the full cycle of work—from touching to completed transactions. The essence of building a funnel is to make an inverted pyramid where unprocessed leads (potential customers who have reacted to the action or communication) will be at the upper level, and deals or repeated sales at the lower level.
Traffic sources include the resources that direct the user to your site—a search engine (Google, Yahoo), a social network (Facebook, Pinterest) or another site.
Unique visitor is a user who visited your website at least once during the reporting time. Every such user is counted only one time.
These are the main parameters of web traffic statistics. How to check your website traffic using these metrics? You can do that with dedicated tools that we’ll tell you about below.
Tools
To get statistics on your web traffic, use one of the website traffic analysis tools.
Many webmasters use the Google Analytics service for this purpose. Thanks to GA, you have an opportunity to check traffic and track the viewed pages, completed conversions and events, as well as to conduct a cohort analysis of the audience, run a split test and rank visitors by interests. The tool is free of charge.
Google Analytics allows you to find statistics only on your site. You can use other services to analyze competitors’ website traffic.
SimilarWeb. The service allows you to get information on any site, as well as to compare resources. Data provided by the service:
- Websites traffic statistics in general and user engagement
- Traffic sources
- Detailed breakdown of data for each traffic source
- Audience interests
- Keywords in organic search and context
- Popular pages
- Competitor sites
- Analysis of the industry and popular sites
- Application analytics
Cost: Free basic reports, the paid version—starting from $199 per month.
Serpstat is another website traffic analyzer. It provides advanced analytics of search queries and visits to the pages of your competitor’s site, allowing webmasters to analyze keywords, paid results, and positions. There is a free basic version. The paid one starts from $69 per month.
SEMrush allows you to analyze competitive sites, traffic sources and keywords, on which competitors are promoted to Google. It offers analytical reports on a variety of parameters:
- Keywords by which the site is ranked in the search results,
- Distribution of positions in the top search results
- Page optimization for mobile devices
- Main competitors (search, context)
- Links
- Video ads
- ATL advertising, etc.
Cost: There is a free 7-day version, then you’ll pay starting from $99 per month.
Alexa collects statistics thanks to browser add-ons that users install themselves. It displays website data with the traffic of more than 100,000 visits per month.
Data provided by the service: Analysis of search traffic, links, site loading speed, keywords for search and context, comparison of several sites. There is a trial period of 14 days, then it costs $149 per month.
Google Analytics: Step-By-Step Guide
To make it clear on how to check website traffic with Google Analytics, we shared an example of analysis below. You will learn how to connect Google Analytics to your site and check its most important parameters.
Website Audience
First, you need to take a few simple steps:
- Sign up with Google or register Google Analytics on your Google account if you already have one.
- Register in Analytics using the username and password of your Google account.
- Enter information about your site: Account name, site name, URL, industry and reporting time zone. Pay attention to the protocol (http / https) and choose the one your site runs on. Enter the real time zone, otherwise, you cannot collect the right data on the visit time.
- Next, you should install the Google Analytics counter directly on your website. Click “Get Tracking ID” and paste it into the site code on all pages before the closing </head> tag. If there is already a counter on the site, but you are not sure that it is linked to your account, you can check by looking at the site code and finding the Google Analytics ID.
- The Analytics counter starts collecting data, and you can start work. Gradually, the Google Analytics counter will process the data from the site, and the page will fill up.
Below, we’ll share an example of analytics from our website.
Visits and Sessions Statistics, Bounce Rate
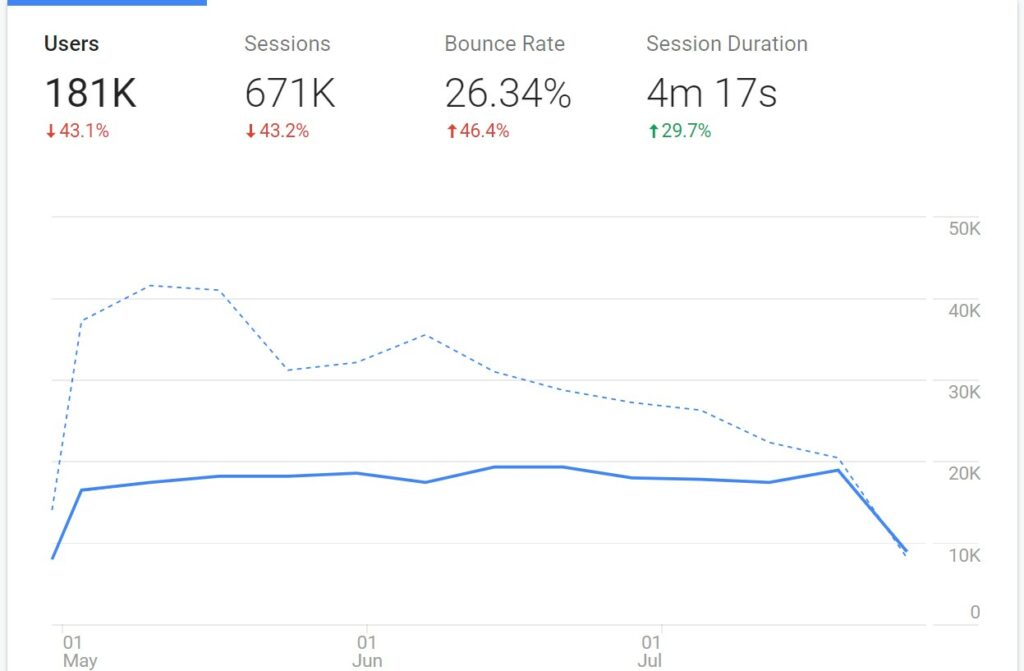
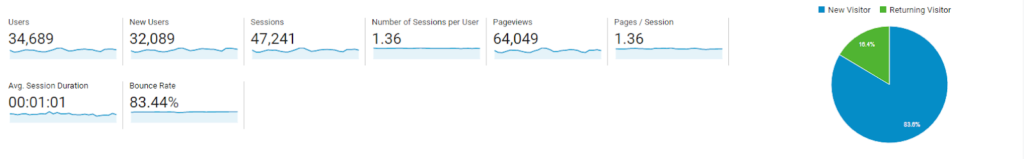
Here, we can see not only static numbers, but also can see them in dynamics and compare, for instance, how the number of visitors has changed over the past 28 days.
Geolocation
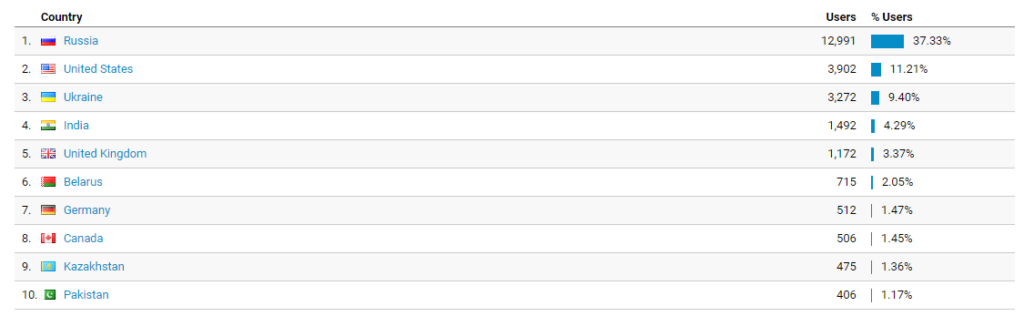
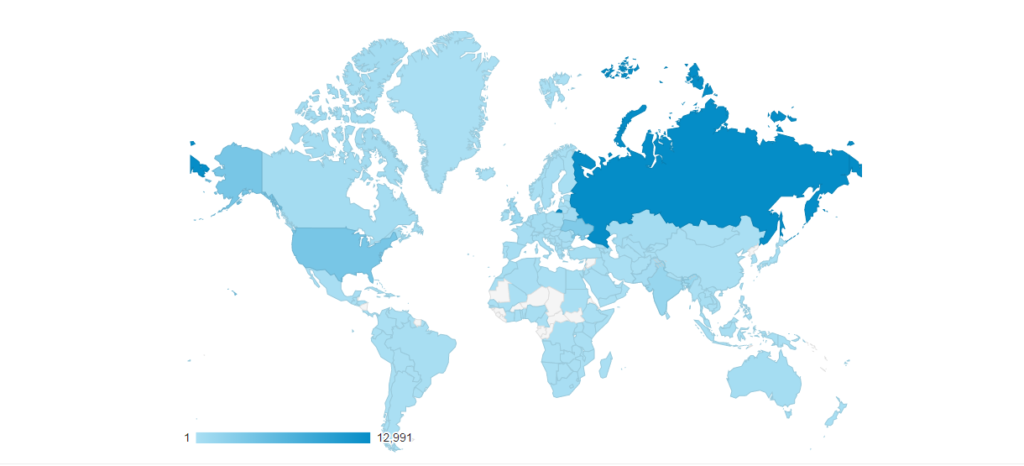
The report on this parameter is presented both in tabular form and in the form of a map for better visual perception.
Visitors’ Age and Gender
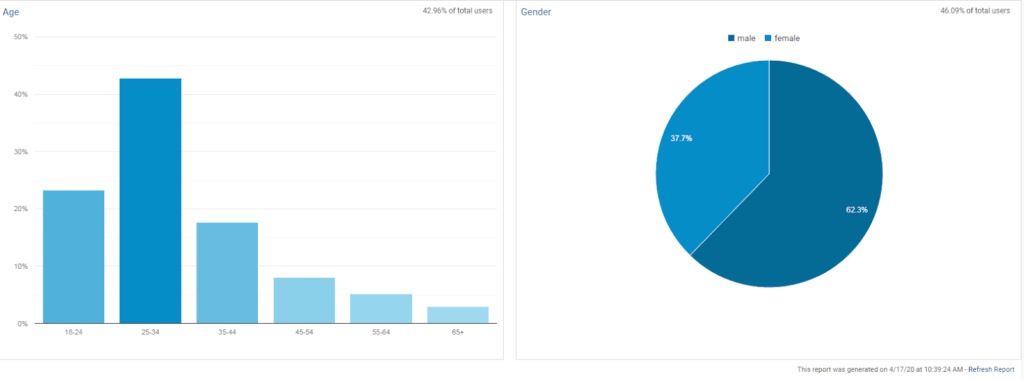
Everything is simple here. You can see whether your visitors are mainly men or women, and of what age.
Device Distribution
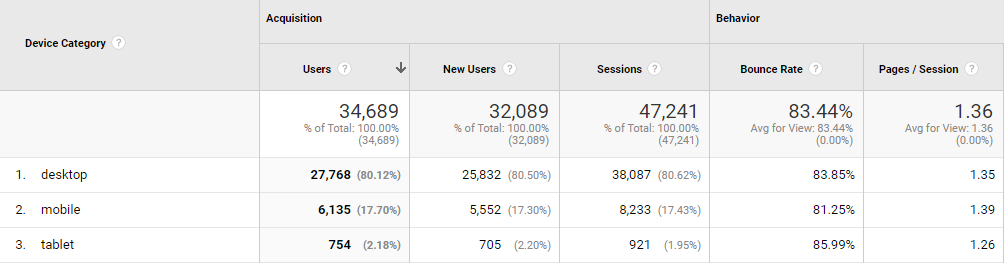
This report allows you to see what devices visitors check your site on and their behavior depending on the device. Our blog is more often visited from desktops, but the number of visits from tablets has grown over the past seven days.
Time Reporting
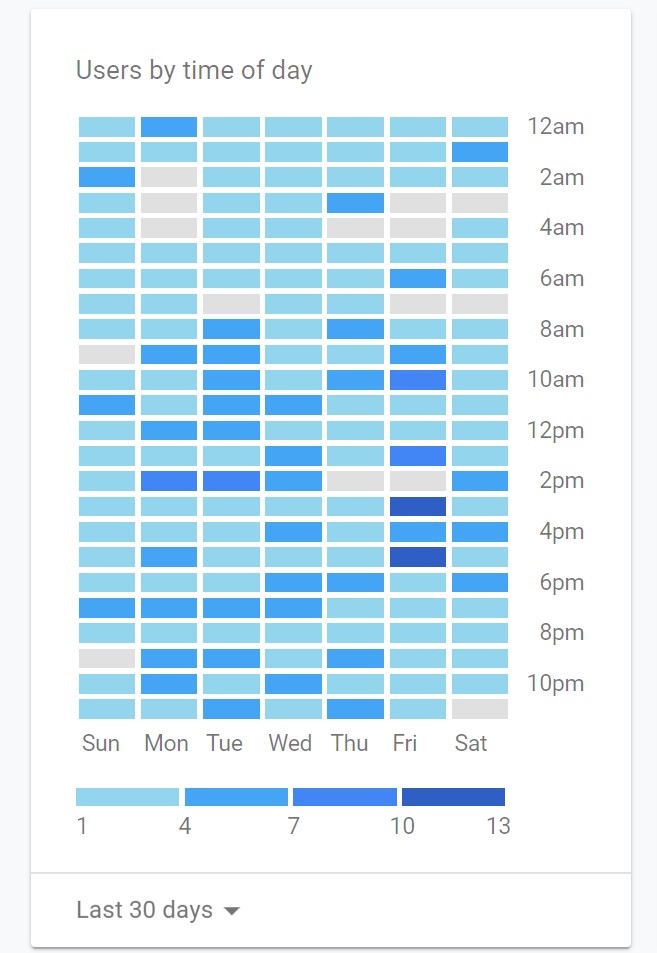
Here you can clearly see the distribution of visits to the site by day and time of day. It becomes most popular on Fridays and Saturdays, and on any day, the visitors come more often in the afternoon.
Of course, you should analyze all the data together and take into account if there was an advertising company, how the indicators changed after some developments on the site, etc.
Channels
Of course, the main reason to start the Google counter for the site is the ability to receive data about traffic and user interest in the site. You can fund such data in the reports. The simplest report that does not require additional settings, for example, connecting goals, is channels.
Go to: Traffic Sources → All Traffic → Channels
Traffic sources may be the following:
- Organic Search shows organic search engine results (the most important indicator for SEO)
- Direct is direct traffic (users enter the site address in the address bar)
- Referral shows referrals from other sites
- Affiliates is traffic from partner sites
- Social shows transitions from the social network
- Display means traffic from display or banner ads
- Paid Search is traffic from paid ads
- Email includes transitions from email newsletters
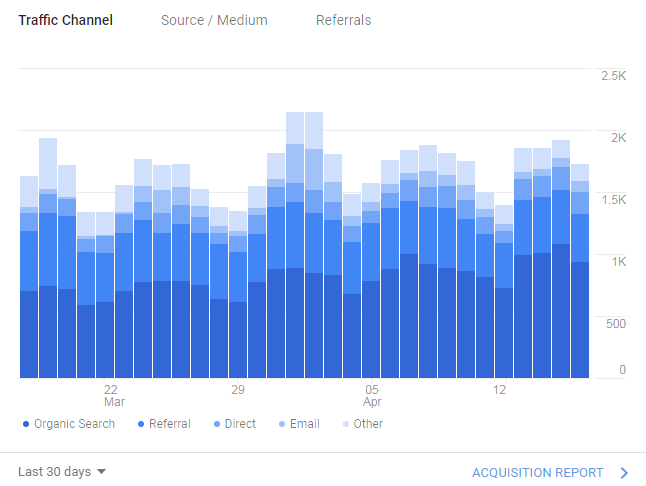
- Other Advertising is other traffic with UTM tags
We have chosen only the most important indicators for us now. They are reflected in the report. In general, it is evident that organic search prevails, and referral transitions are following it.
Google Analytics developers understand how difficult it is to install a Google counter on a site and set it up, so they developed many services to help:
- Analytics Help
- Test account available to everyone (it’s impossible to set up a Google counter, but you can click on reports and settings)
- Analytics Academy that offers free online courses
How to Analyze Your Website Traffic Efficiently
Website analysis allows you to abandon ineffective methods of promotion, find new sources of traffic, raise positions in the SERP and, as a result, increase revenue. It is up to you as to how you will check your website traffic, using simple and affordable Google Analytics tools or other services. The main thing is to do it constantly and make the right decisions for further advancement based on the analysis.