
How Google Tag Manager Differs From Google Analytics
Google Analytics mainly aims to collect data about visitors of a website or an app. To do this, you need to add a tag to the source code of your project and then monitor any data update. Google Analytics has lots of standard reports that give you detailed information about visitors. Reports include everything from their gender and age to device and region. Google Tag Manager is not a GA alternative. Through tag dispatcher, you can collect codes of other external services and user`s HTML in one place. The integration process is carried out through CTRL+C and CTRL+V and doesn’t require any programming skills.
GTM helps webmasters operate tags in the visual constructor. If you plan to solve basic tasks, you can use built-in templates and code examples from the web. With this service, you can add “Metrics,” “Analytics,” pixels of social networks and other integrations to your website.
Does a webmaster need all instruments
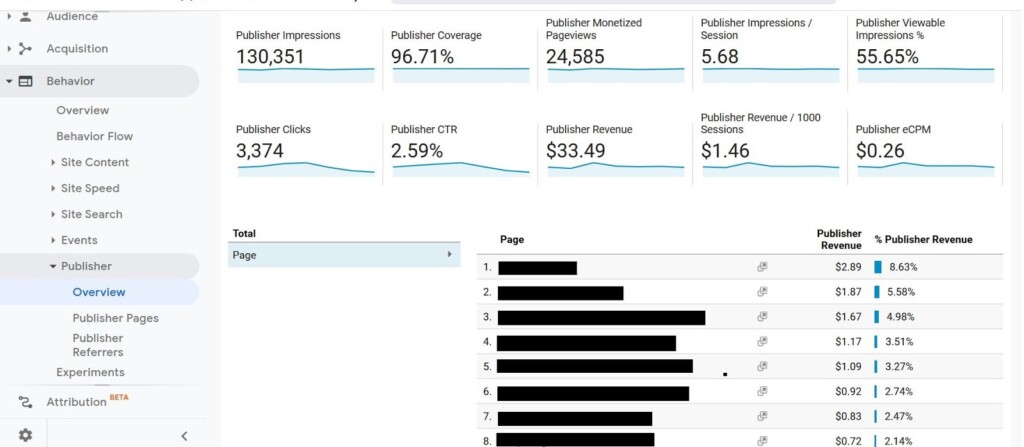
Google Analytics has a complicated interface and a detailed reports system. Transition to GA from native Yandex.Metrics might not be easy. At first, the service will seem unfriendly and difficult but is vital nevertheless, especially if you monetize your website through Adsense. Thus, the reports will show general statistics as well as the income that a particular page brings.
For content projects, it is better to use Google Analytics and Yandex.Metrics together to take advantage of features of both systems. “Metrics” has a “Webvisor” component that records user visits. With it, you can learn how your website visitors interact with forms, links, and buttons. Yandex.Metrics also has scroll and click maps. GA does not have any built-in analogs but you can configure a similar function manually.
Google Analytics can:
- Track audience performance
- Evaluate the effectiveness of marketing channels
- Count conversions based on specified templates
- Analyze page loading speed
- Check website availability
- Collect e-commerce data
- Show data updates in real time.
GA has more than 90 reports on different criteria. However, content projects don’t need all of them, so pay attention to these basic statistics:
- Real-time report
- Statistics on devices, demographics, technologies, and behavioral factors
- Behavior map
- Loading speed
- Conversion
Google Analytics Setup via Tag Manager
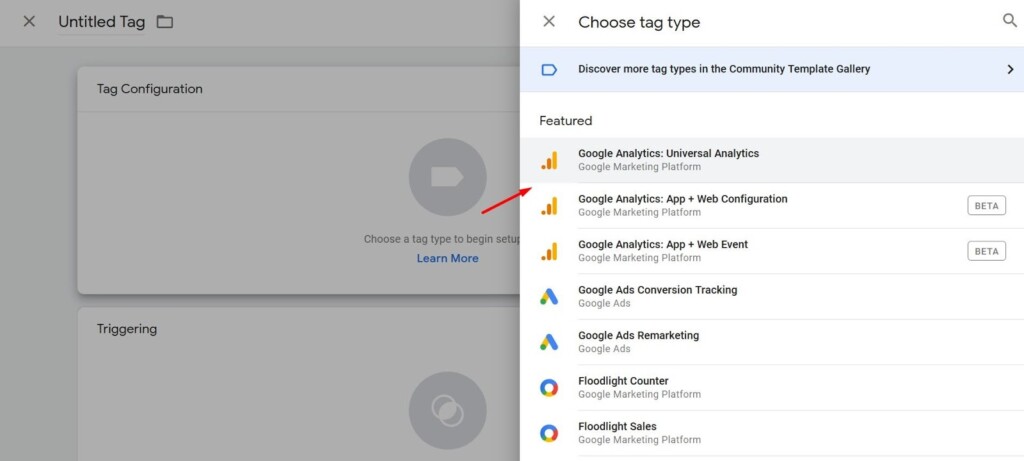
We’ve already mentioned that it is possible to set up one of the popular analytics systems or random code through GTM. Basic templates of “Tag dispatcher” contain the Universal Analytics tag, which can help integrate Google Analytics.
Before the setup, create a property in GA and a workspace in GTM.
Then follow the steps:
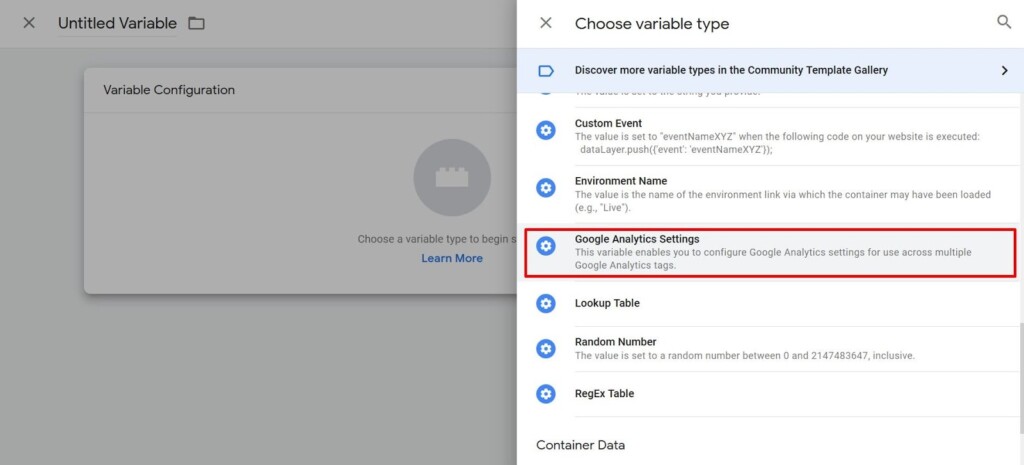
- Go to the “Variables” page in Tag Manager and add a new element of the “Google Analytics Settings.”
- Find the “Tracking ID” in Google Analytics.
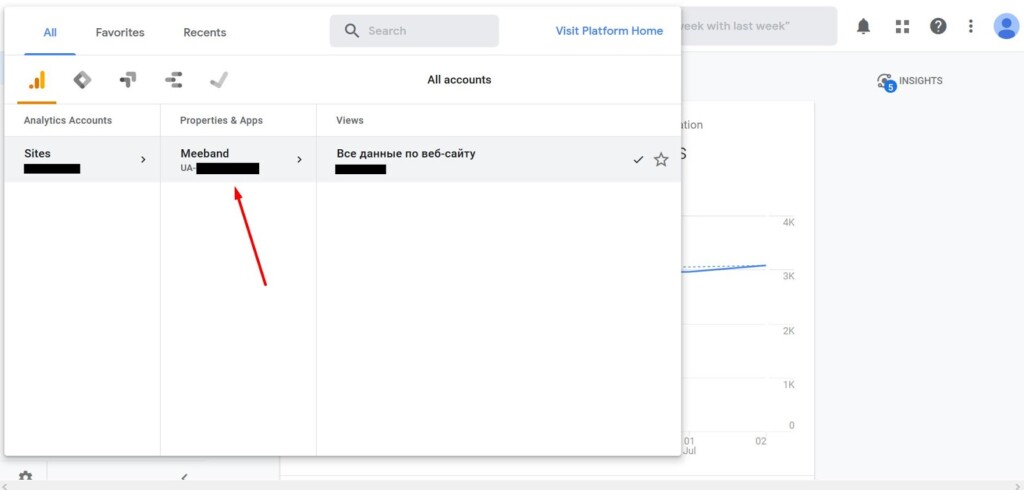
- Insert it to the corresponding field.

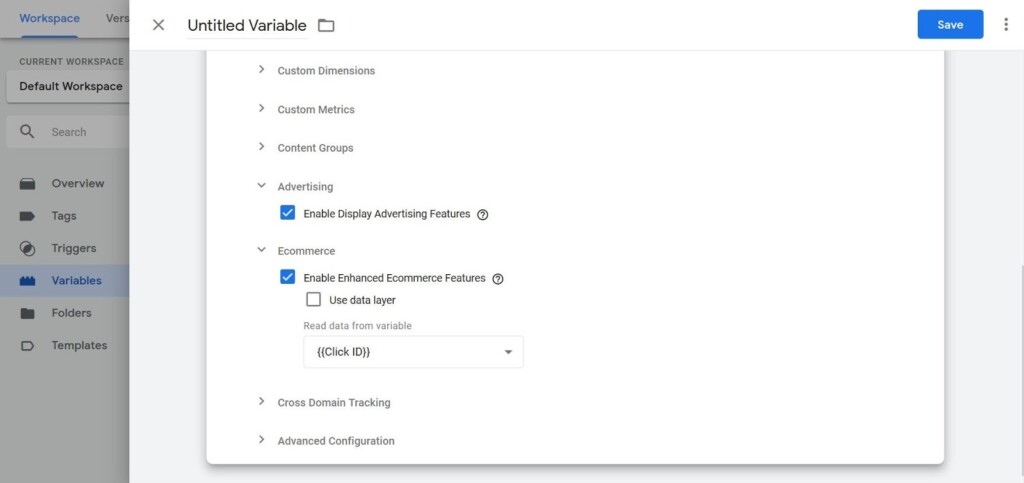
- If you plan to use context advertising on the website or track e-commerce statistics, activate functions in the “Additional settings” section.
- Go to the “Tags” tab and add a new Universal Analytics tag.
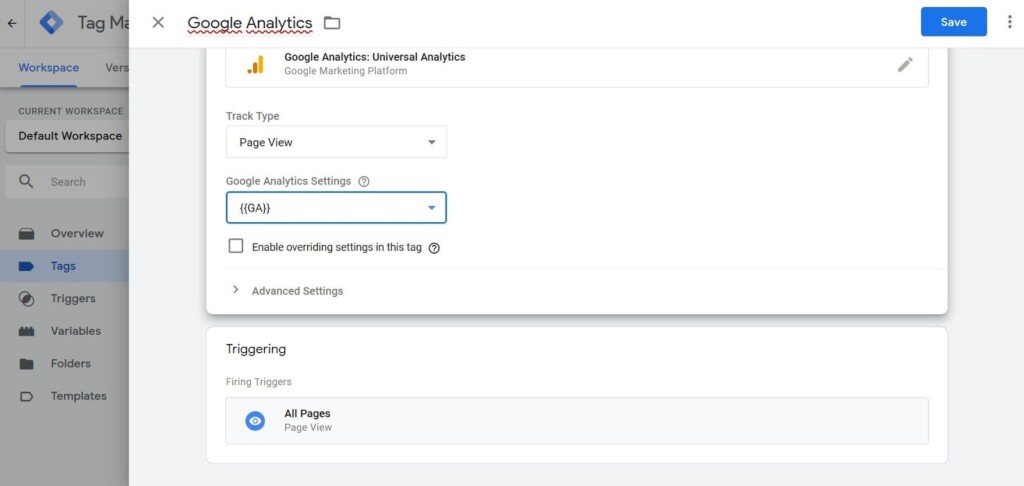
- Leave the review mode in the field “Type of tracking” and choose the variable that you created in “Settings of Google Analytics.” Add “All Pages” to the section of triggers and save the settings.
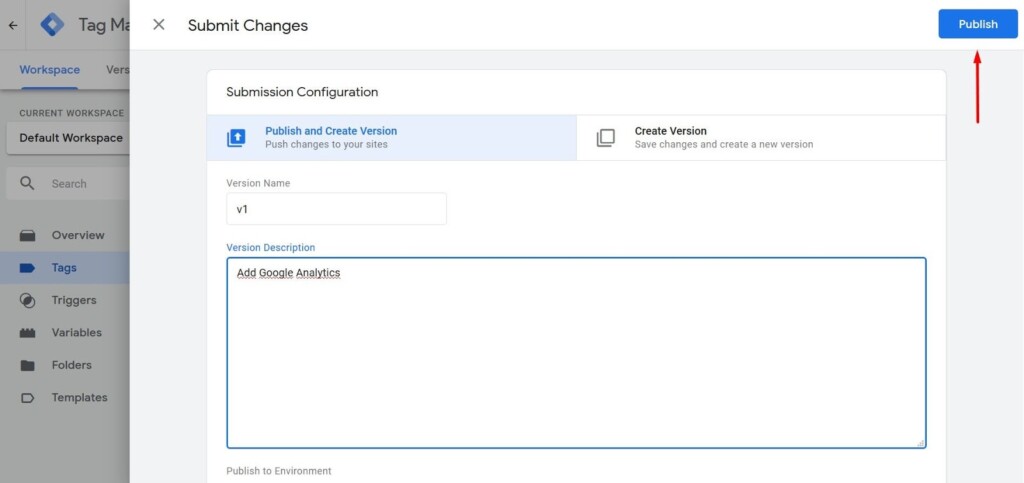
- Publish the changes by clicking “Send.” We recommend filling in the field “Version description” so that you don’t need to memorize changes within the container.
After sending the code to the website, open the “Real time” report in your Google Analytics account. If your project already has visitors, the figures will update. Otherwise, make sure to check the settings. The most frequent errors are indicating wrong GA ID in the variable settings or failing to publish the changes in the container and saving them instead.
Target Audience Analytics
Any successful content or commercial project is a result of constant development. You need to analyze your target audience performance, test various advertising formats, amend the structure and see how visitors react to new features.
Conversion rates help track effectiveness. These are targeted actions that the website owner considers crucial. Conversion differs significantly for informative and commercial websites. For example, for online stores it’s important to track average check, customer journey, popular goods, and other characteristics.
There are two main directions for content project owners: indicators of engagement and revenue. Engagement-wise, pay attention to visit and scrolling depth, visit duration, reading statistics, popular authors, conversion of visitors into subscribers, and other metrics.
It is harder to evaluate e-commerce indicators, though. “Metrics” and “Analytics” allow you to see the website revenue in context networks. To gather all the information together, you need a specialized service like FinPL.
With Google Tag Manager, you can significantly expand opportunities of Google Analytics: Set up click count for the social networks buttons and external links as well as form analytics, etc. For more complicated tasks, you’ll need basic knowledge of HTML and Javascript, which will come in handy for any webmaster.
Setup of conversion events
By using both GTM and GA, you can perform almost any analytical task. For example, track the number of clicks in the search form or count users who subscribed to updates via email. As an example, let’s set up the “Page visits” goal. A lot of travel blogs have subscription forms that help their owners collect emails of those interested. They can be used for marketing and sending out blog post updates.
For WordPress blogs, there are lots of ready solutions for counting subscribers: MailChimp, SendPulse, FeedBurner, etc. The easiest way to count email subscribers is to redirect users to the special “Thank you” webpage once they fill in the subscription form. The user will see a message with gratitude, while the blogger will gain another subscriber and see them in the analytics system. To do this, set up a subscription form and a webpage with redirections that we plan to count. If you use MailChimp, read its official instruction. For the statistics to be collected correctly, hide the “thank you” web page from search robots and users.
Then follow the steps:
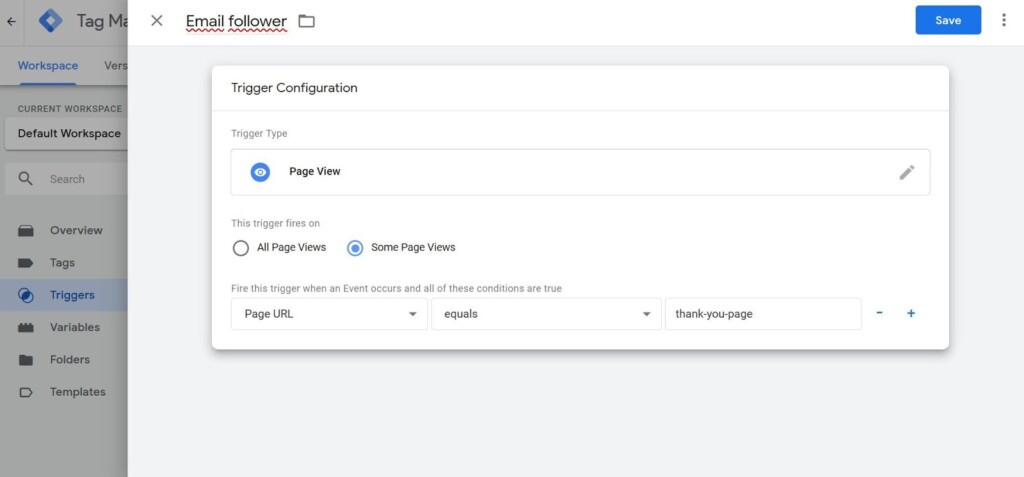
- Open the “Triggers” page in Google Tag Manager.
- Create a new “Page views” trigger.
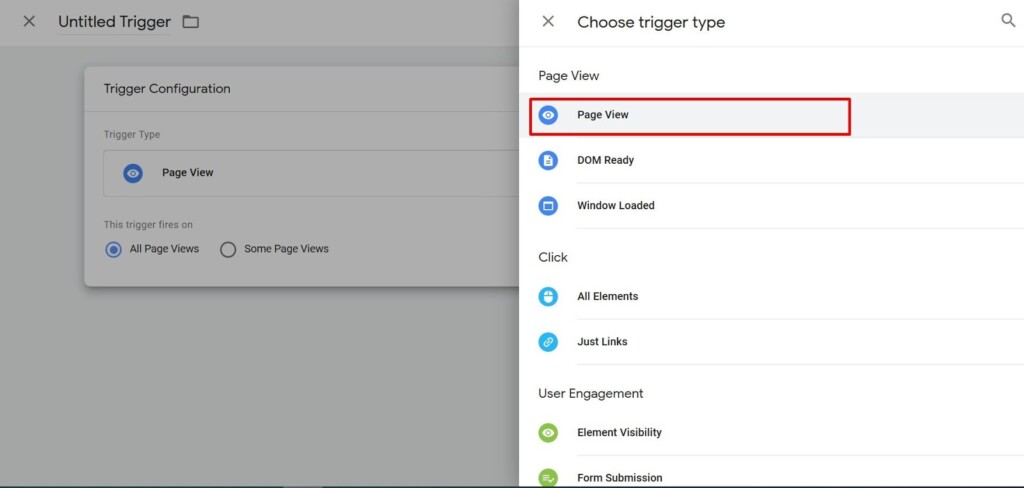
- Fill in all the fields as on the screen shot. Put the value of the page “Thank you” in the activation rules.
- Save the trigger and add it to the Google Analytics tag that we created in the previous section.
- Fill in the form for the test and visit the “Thank you” page.
- Check the data display in Google Analytics.
In the same way, you can set up analytics of the search bar on the website for example. This information will be useful when you check content relevance. If the blog is dedicated to Thailand and users frequently look for information about insurance policies, you will get to know about it. Statistics will be reflected in the special section of GA. When you finish the setup of the search phrases analytics in GA, a “Website search” menu will appear.
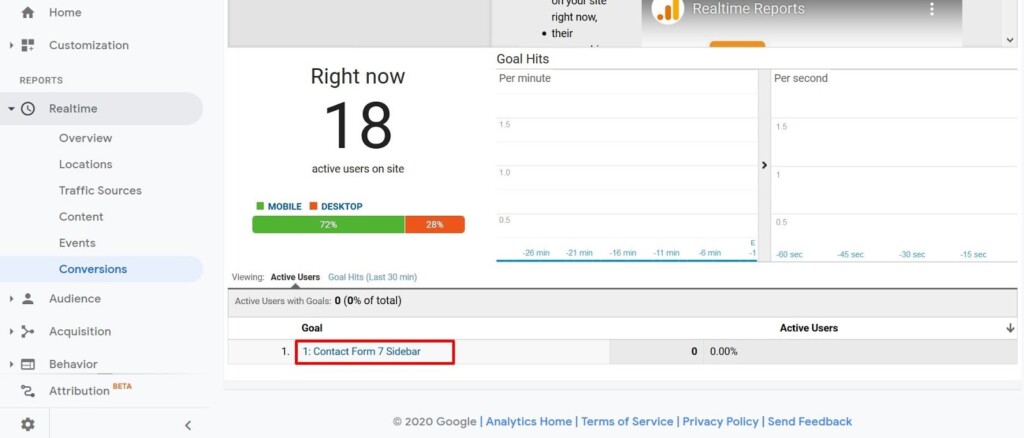
To track conversion statistics, follow the steps:
- Open Google Analytics.
- Find the section in “Real-time report”.
- Choose “Conversions”.
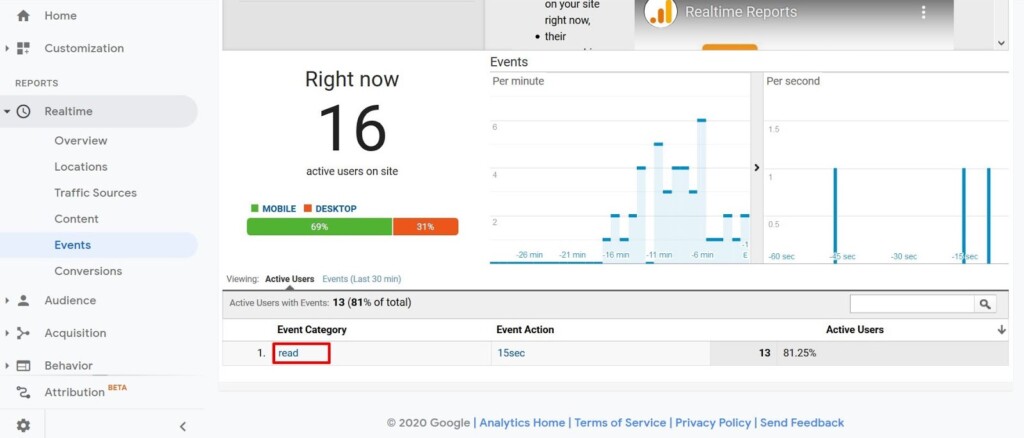
In “Events,” you see action statistics. For example, if you change the standard mechanism of the failure count, you can learn how many active users on the website have overcome the 15 second barrier.
After adding tags or triggers into Tag Manager, you can check the changes in the preview mode. For this, you have to press the button of the same name on the main webpage.
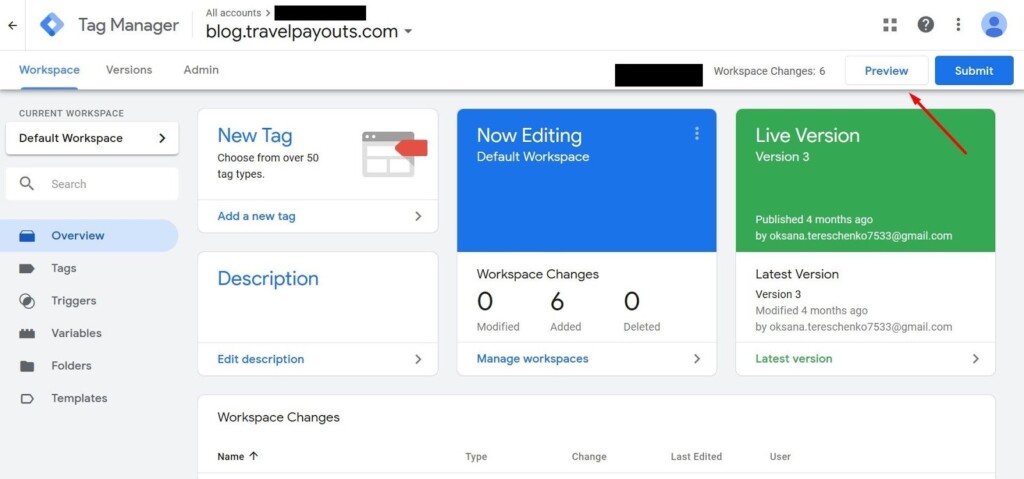
If the GTM code is installed correctly, the website will be divided into two parts. The first one will include the content and the second one will include a debug console with the information about tags and the order of their launch. The latter will only be visible to you and the users who have a link for review.
Useful Reports
We have already mentioned that Google Analytics has a lot of basic templates and you need to spend plenty of time looking through all of them. We are going to highlight the most important ones that help you get a better understanding of your audience and their needs.
Search Results
The “Search Results” report will help you to understand where your site’s pages are located. You will learn which of your content is most in demand, which search queries users come to your blog to learn about, and which of your articles would be the best to update. After all, Google really loves updated content.
Learn how to determine which blog posts need to be updated and how to optimize your blog content. Watch the recording of our webinar with Laura Peters, entitled “SEO Tutorial for Travel Bloggers: Get More Traffic From Old Blog Posts”, or its recap.
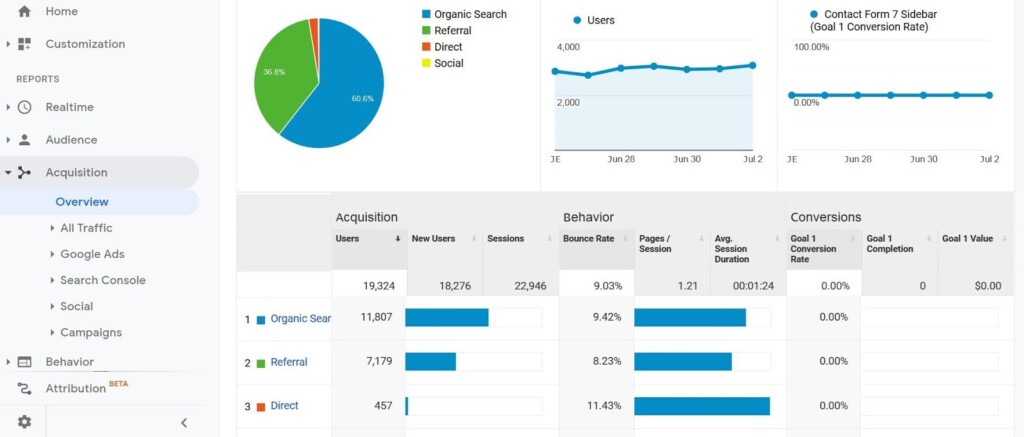
Traffic Sources
This group encompasses information about redirecting from different channels. You can see all traffic for each channel and learn how many people come from social networks and marketing platforms. If you have an active company in Google Ads, you can set up a connection and see detailed statistics in Google Analytics.
Traffic sources are the heart of the project. The tab shows statistics for the chosen period with visual graphics and diagrams. There is also an option to export materials in PDF, Excel, and Google Docs.
Audience
If you want to know the audience gender, age, or interests for a blog or content website, make it your rule to analyze data from the page “Audience” from time to time.
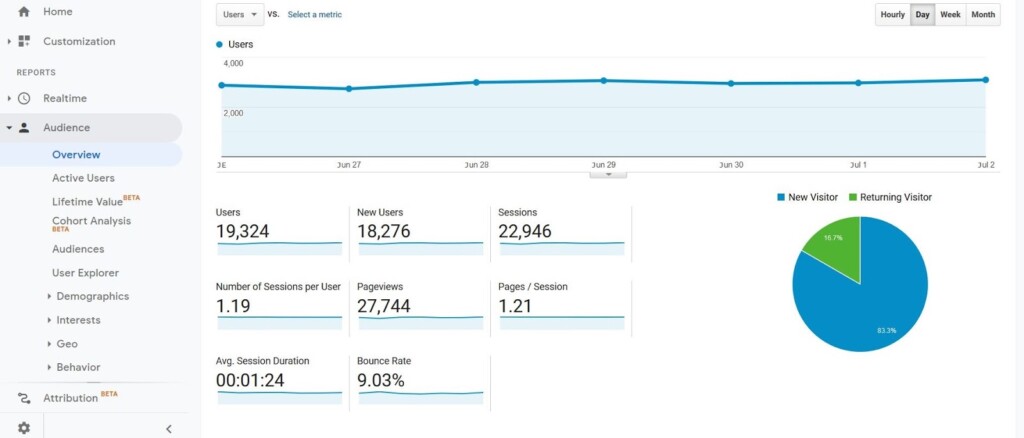
What you can learn:
- Gender
- Age
- Region
- Language
- Operating system
- Devices
- Indicators of engagement
- Size of active core
There is an interesting “User flow” module in this section that shows a map of movements across the pages. It depicts what materials are closed by the visitors more frequently and how many clicks in the Adsense blocks they completed.

Conversion
This tab contains information about target actions. To see the statistics of “E-commerce” for a commercial project, you need to activate a corresponding option in Google Analytics and set up integration.
For informational websites, this webpage shows statistics for previously set aims: standard and user ones from Google Tag Manager.

Owners of informational websites and travel bloggers should study functions of Google Analytics and Tag Manager. You can do it step by step, but set up conversions at the beginning to collect statistics for a long period. For example, if you added a new subscription form to the website, set up a trigger in GTM and add a goal in “Analytics” to compare effectiveness of several options.
Developing content projects without analytics is like driving in a new city without a navigator. You can get to your destination, but this will take more time.