How to Access YouTube Analytics
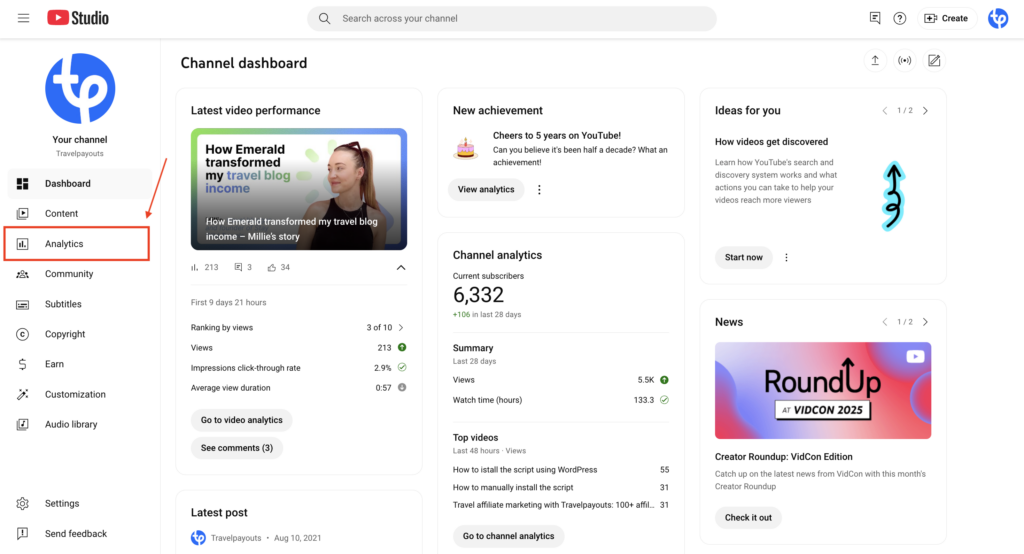
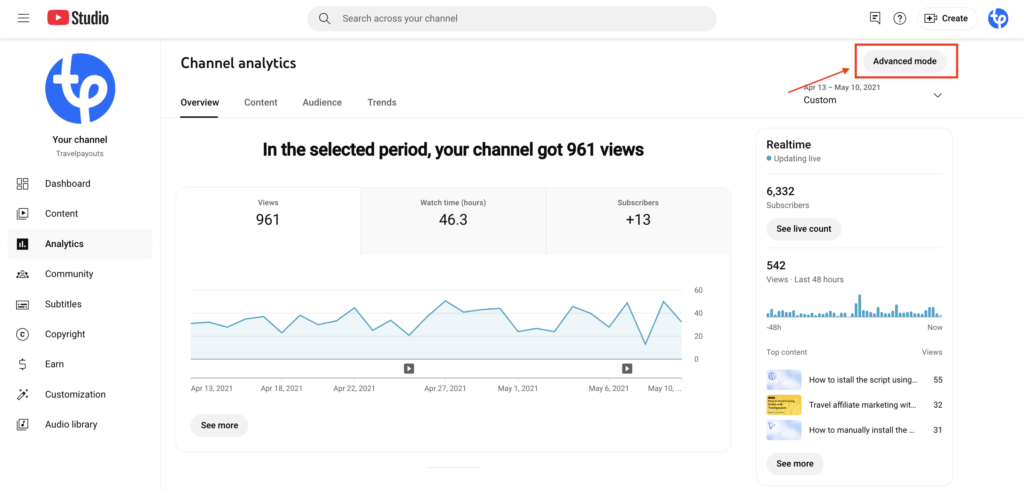
In order to see YouTube analytics on desktop, log in to your YouTube account, hover over your profile icon in the top right corner, and click “YouTube Studio.” Then, click “Analytics” in the left-hand menu.
To check YouTube Analytics on mobile, you’ll need to download the YouTube Studio app.
If you don’t have a channel yet, start by creating a brand account for your business. It will allow you to assign multiple people to the channel and make handling the account easy. By contrast, if you move the existing channel to a brand account, some content may be lost, for example, the channel’s custom URL verification badges, messages, etc. So it’s best to create a brand account from the very start if you plan on assigning different managers.
YouTube Analytics Overview
In the section below, you’ll find an overview of the main parts of the YouTube Studio dashboard. It consists of four main sections: Overview, Reach, Engagement, and Audience, but you can also check detailed statistics in the Advanced mode.
Overview
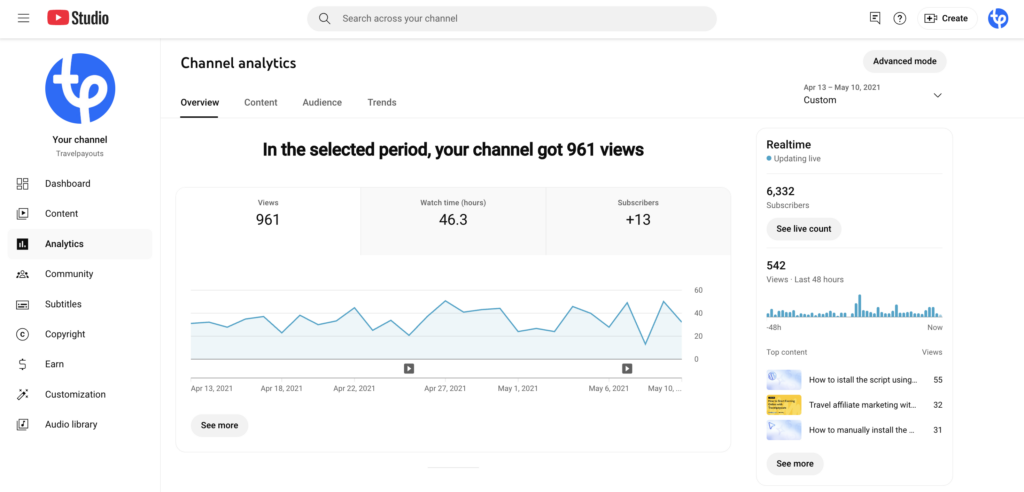
The first section that you’ll see in the dashboard is Overview. There, you’ll be able to see metrics such as views, watch time (hours), and subscribers for the selected date range, as well as your top videos. While it takes some time for Youtube Analytics to process the data, on the right you’ll see a real-time report for the same metrics.
- Views. This metric shows the number of times your channel has been watched over the selected time period. The minimum time that counts as a watch depends on the video length and in general is 30 seconds.
- Watch time. This is the total amount of hours that your channel has been watched.
- Subscribers. This is a difference between subscribers gained and subscribers lost for the selected period.
- Real-time views. The number of views of your videos for the last 48 hours. While YouTube needs some time to process data to show it on the chart, this metric is updated in real time and can be especially useful to monitor the performance of YouTube Live or a video you’ve just published.
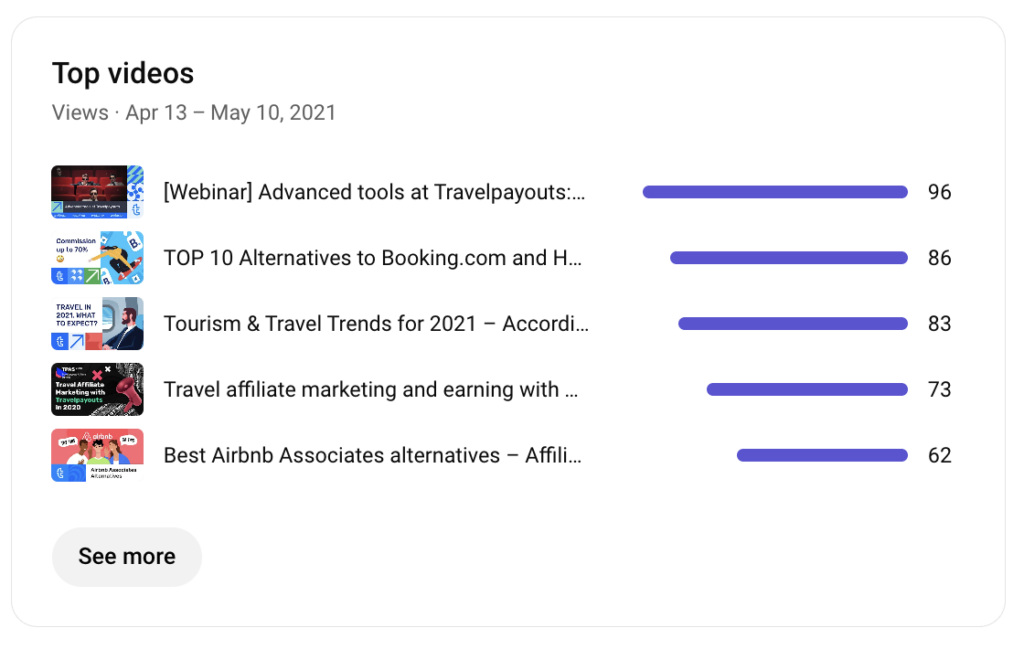
- Your top videos. A list of your top-performing videos for the selected date range.
Reach
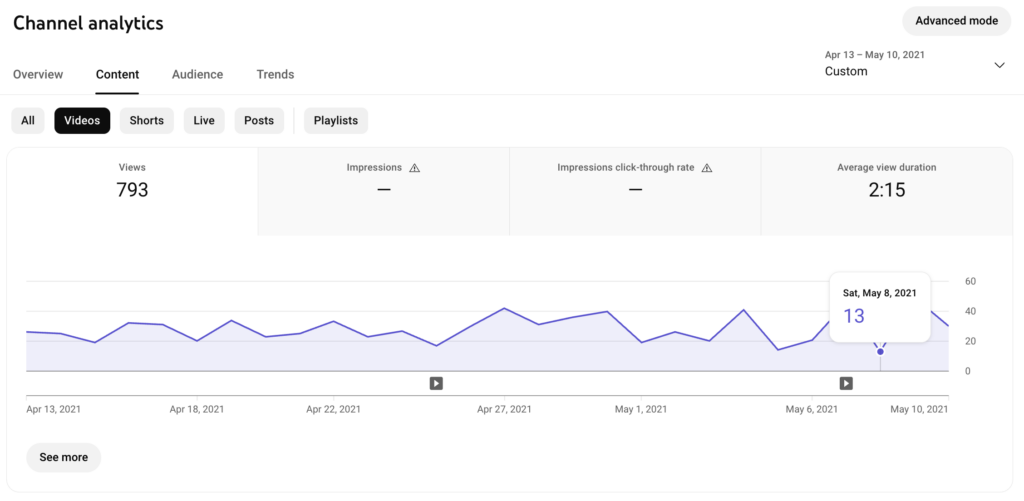
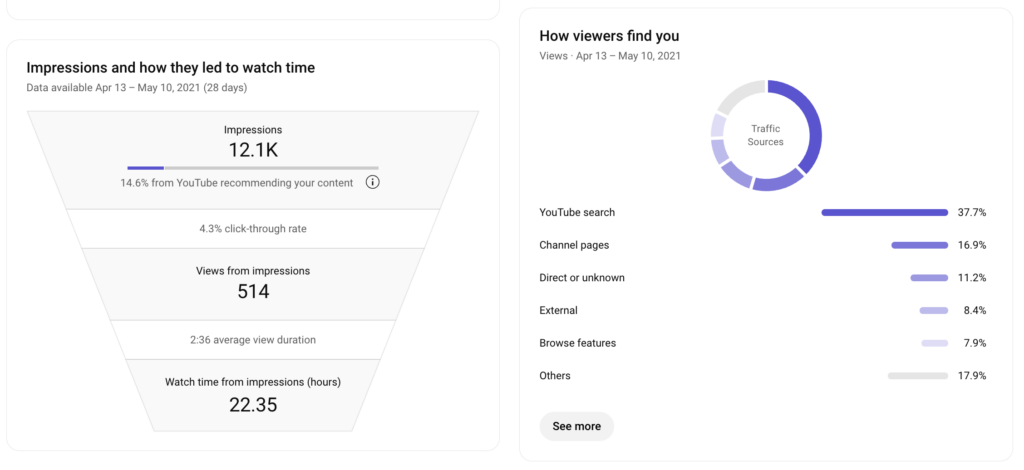
The Reach section displays impressions, impressions click-through rate, views, and unique viewers.
- Impressions. This is the number of times users have seen your video thumbnail.
- Impressions click-through rate. The percentage of users that clicked your video thumbnail.
- Views. This report shows the number of times your video has been watched for the selected time period. The minimum time that counts as a watch depends on the video length and, in general, is 30 seconds.
- Unique viewers. An estimate of the number of users who watched your videos over the given period.
You’ll also see traffic source types and the relation of impressions to watch time.
- Traffic source types. These are the ways users find your content, such as YouTube search, browse features, channel pages, playlists, suggested videos, direct, external, etc.
- Impressions and how they lead to watch time. This report visually shows how the impressions of your thumbnails lead to views and watch time, and you can see the percentage of impressions from YouTube recommending your videos. These figures may differ from the key metrics on the chart, because the latter are updated more frequently.
- Top search terms. You can see the top queries that led users to your channel. This metric can greatly help fine-tune your SEO strategy with the right keywords.
Engagement
The Engagement section shows watch time and average view duration as well as top videos, playlists, and end screen element types.
- Watch time. This is the total amount of hours that your channel has been watched.
- Average view duration. The average amount of time watched per view.
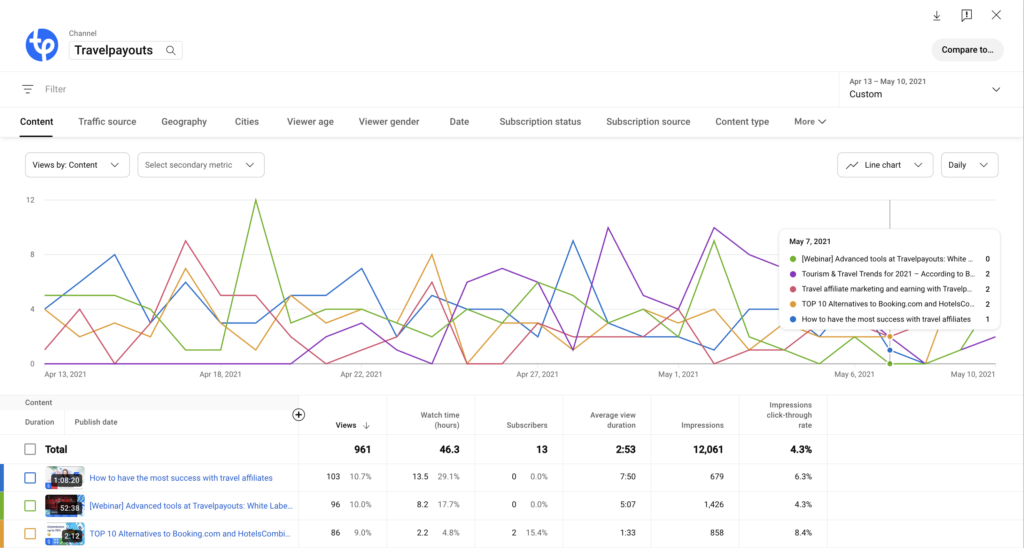
- Top videos. These are your most-watched videos over the selected time range.
- Top playlists. These are your most popular playlists. In the Advanced mode, you can check the number of views, average view duration, and watch time for each playlist.
- Top cards and end screen elements. These are elements that work most efficiently. You can see how often users click an end screen or a card of a particular video in the Advanced mode.
- Top videos by end screen. These are the best-performing end screen videos of your channel.
Audience
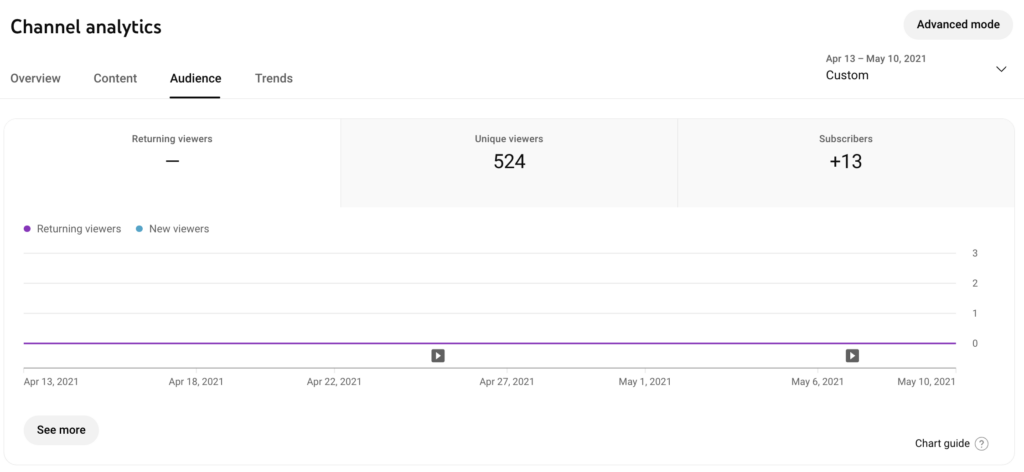
Use metrics in the Audience section to understand what users watch your videos so that you can adjust your strategy accordingly.
- Returning and new viewers. The chart shows the number of returning visitors who have already watched your channel, as well as the number of new visitors for the selected time period. The last category also includes users who watch videos from private browsers, delete their watch history or come back to your channel after a year.
- Unique viewers. The number of users who watched your channel for the given period not including multiple views from the same person.
- Subscribers. This is a difference between subscribers gained and subscribers lost for the selected period.
- When your viewers are on YouTube. These are days and times most of your channel’s visitors are online. This metric can help you plan uploads and lives most efficiently.
- Watch time from subscribers. This is your channel’s watch time divided between subscribers and non-subscribers.
- Age, gender, and top geographies. Demographics are helpful for targeting content to a particular audience.
- Other channels your audience watches. These are other channels that your viewers regularly watched over the last 28 days. Use the report to learn about their interests and find collaboration opportunities.
- Other videos your audience watched. These are the videos the visitors of your channel watched other than yours over the last 7 days. This can help you find more enticing topic ideas for your channel.
- Top subtitle/CC languages. You can see if viewers use subtitles and what languages are most sought-after, if so.
Revenue
If you take part in the YouTube Partner Program, the dashboard will also show you the Revenue tab. There, you’ll be able to learn which videos earn you the most money and through which income sources.
- RPM (revenue per 1,000 impressions). The report displays the amount of money you earned per thousand video views.
- Playback-based CPM (cost per 1,000 impressions). An estimate of the average gross revenue per 1,000 playbacks with one or more ads.
- Revenue sources. This is a breakdown of estimated income from each income source.
- Transaction revenue. This is an overview of estimated revenue from channel memberships and merch.
- Top-earning videos. The report displays videos that have generated the highest estimated revenue.
- Ad type. The percentage of your ad revenue that comes from each ad type.
Advanced Mode
In addition, you can choose the Advanced mode to get detailed reporting.
This section displays the following metrics that will help get deeper insights into your channel’s performance:
- Playback location. This report shows where your videos are being viewed: whether users discover them on their feed or specifically search for them, view content on YouTube, or on different platforms.
- Devices. These are devices that your viewers use to watch your videos: desktop, mobile, smart TV, or gaming consoles.
- Translation use. The report shows whether users watch the original video or its translated versions and helps understand whether translation improved your reach and discoverability.
- Operating system. The report shows which operating systems viewers have used when watching your videos.
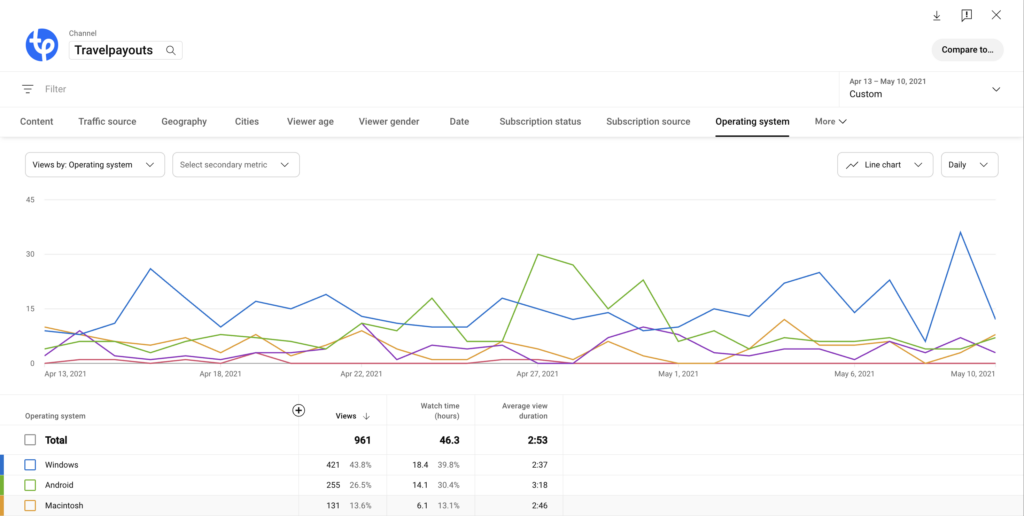
- Sharing service. You can see when users share your videos and what app or platform they share it on. Only shares generated via the share button are measured.
- Card and card type. The report measures the performance of cards that appear at the end of the video, including the number of times card teasers were visible, the number of clicks on a teaser and an individual card, and the CTR of each card.
- End screen element and end screen element type. You’ll learn about the number of end screen elements shown, end screen element clicks and clicks per end screen element shown.
There, you can create customized tables and compare metrics over time or compared to your whole content. Advanced mode also allows you to export data as a Google Sheets or .csv file.
You can also install one of YouTube Analytics extensions like vidIQ that displays real-time statistics and allows you to track your channel wherever you are on YouTube. Then, you won’t have to open the analytics dashboard each time you want to check your channel’s key figures.
What Metrics Should I Track?
While Youtube analytics offers a great variety of metrics, it doesn’t mean that you should track all of them. Depending on your brand goals, some metrics will be more revealing than others. Below, we’ve gathered the most important indicators to track for most common marketing goals.
Increase Views
If you aim at increasing views for your channel, make sure to monitor the following metrics:
- Views. This metric shows the number of times your video has been watched over the given period. The minimum time that counts as a watch depends on the video length and, in general, is 30 seconds.
- Watch time. This is the total amount of hours that your video has been watched.
- Average view duration. This is watch time divided by views.
- Average percentage viewed. This metric is the average view duration divided by the length of the video as a percentage.
Grow Subscriptions
If you want to grow subscriptions to your channel, there is one metric you should pay particular attention to, and it is the number of your subscribers gained and subscribers lost. These are users who subscribed or unsubscribed from your channel on a particular video. The metric will show you that this video was particularly interesting or vice versa didn’t meet the user’s expectations.
Boost Engagement
To understand how engaging your content is, make sure to monitor the following metrics and act upon them:
- Views
- Likes, dislikes
- Shares
- Comments added
- Subscribers gained, and subscribers lost
Set aside time to read the comments and analyze your audience’s feedback. It can be an invaluable source of insights on your channel performance and ways to promote it.
Drive Revenue
If you aim at driving and increasing the revenue from your channel, the following metrics will help assess the success:
- Transactions and transaction revenue. This is the overall number of transactions from paid content and the revenue they brought in.
- CPM (cost per 1,000 impressions) and RPM (revenue per 1,000 impressions). These metrics will show you how many users should see your videos for you to make one dollar.
Please note that the data is available for accounts in the YouTube Partner Program.
How to Improve Your Marketing With YouTube Analytics
Now that you know which metrics are most important for your business, it’s time to put that knowledge into practice. Below, you’ll find tips on how to use your Youtube analytics report to improve your marketing strategy.
Create More Engaging Videos
Understanding YouTube Analytics will provide you with invaluable insights that can help create better videos. It will show you what works and what doesn’t to hold your audience’s attention. And you can start by analyzing audience retention. The graph will show you how much of the video users watch and at what point they leave.
In the example below, the video is 2 minutes and 35 seconds long, but the average view duration is 1:21, which is 52.8% of the video. As you play with the tool, the line will move along throughout the video and demonstrate when viewers leave.
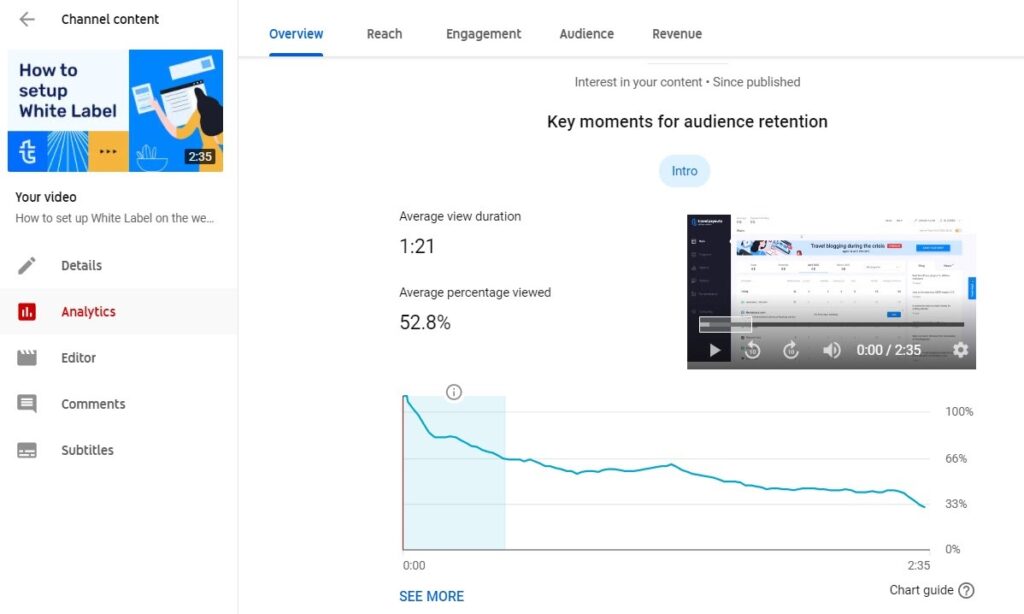
This will help you understand which parts are most engaging and at what moments you lose people’s attention. To improve existing content, you can, for example, add CTAs before users click away. In your future videos, you can replicate moments that turned out successful and avoid elements that make users leave.
Discover Traffic Sources
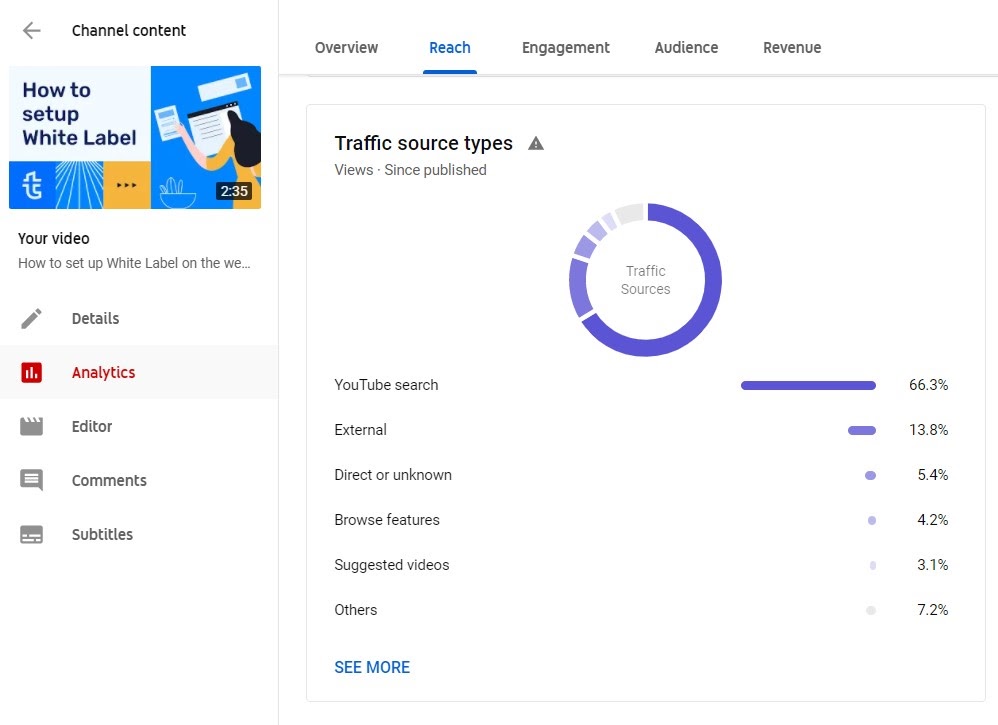
Not everyone discovers your content in the same way. Exploring YouTube Analytics traffic sources will help you avoid wasting time and effort on unprofitable sources and focus on the ones that perform well. Go to the Reach tab and check the Traffic sources by type section, which is available as a pie chart and as a graph.
Here are a few ideas on how to use this information to your advantage. Check which keywords people used to find your video and optimize its description to drive even more traffic. Also, learn which sites host your videos in the Externals report and find more partnership opportunities with relevant blogs based on this data.
In the example below, YouTube search is the largest source of traffic, so it makes sense to consistently optimize video titles, descriptions and meta tags for SEO. External traffic is much lower, but checking which websites have shared the channel’s content may give valuable insights and new partnership ideas.
Target Videos to Your Audience
If you know who watches your videos, it makes it easier to meet users’ expectations and achieve more success. On the other side, if you find out that the users you reach aren’t your target audience, you can change the strategy.
YouTube audience insights include information about viewers’ age, gender, geography, device type, and more. You can find more detailed information for each particular video in the Advanced reports. Then put this information into use and work out a way to improve your outreach.
For example, if most of your views come from mobile devices, keeping your content short and optimizing for mobile will improve user experience and may boost your channel performance. Or, if there is an engaged audience in a particular location, you may tailor the publication time to their time zone, translate subtitles if they speak a foreign language, and so on.
What’s more, you can target ads and reap twice as many benefits, as they prove more efficient.
Improve Your Title and Thumbnail
Titles and thumbnails are important elements that can significantly impact your click-through rate. One way to improve your title and video description is to add keywords that people use when searching for content like yours. This will help rank higher on search results and increase chances of users seeing your content.
To find the most suitable keywords, you can use keyword research tools that help discover keyword ideas, check their competitiveness, monthly searches, and so on. You can also type in your topic in the search results of YouTube and explore which keywords are used in the top-performing videos.
Thumbnails help attract attention, stand out from similar content and connect with viewers on a visual level. Make sure to customize thumbnails. You can find YouTube’s best practices in this guide to making effective thumbnails. In the meantime, here are a few tips to begin with:
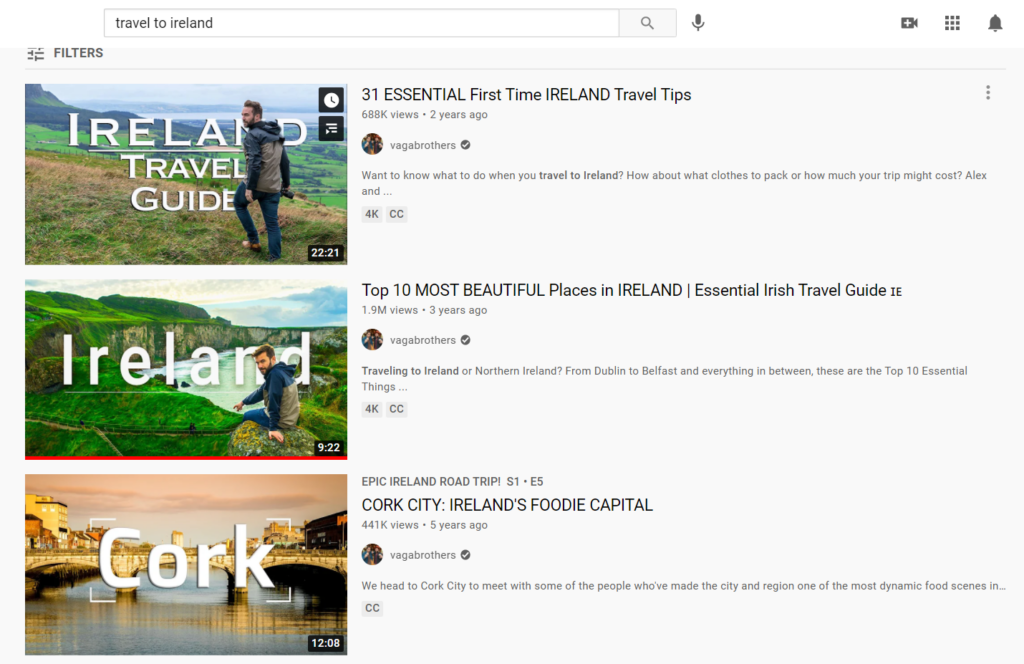
- Include a person. Human brain better remembers faces rather than text or color, so by using a picture of a person you’ll have higher chances of attracting users’ attention in the search results. A great example of using people’s faces can be found on the Vagabrothers channel.

- Add text. Inform users what your video is about by adding relevant words that’ll complement the title and provoke interest. Remember to not use any text in the bottom right corner of the thumbnail, as on mobile devices it displays the video length, so your text may get lost. For example, Touropia adds names of places for each video:

- Use branded layout. Consistently using a branded look will help the audience recognize your videos from thousands of others. Make sure to use the same fonts and colors throughout your videos, just like Ryan Shirley:

- Invoke emotions. Choose pictures that convey the emotions you want users to feel. For example, a happy man in the thumbnail of the following video from the Yes Theory perfectly reflects the topic:

To create powerful thumbnails, you can make use of dedicated tools like Photoshop, Canva, Adobe Spark, Fotor and the like. Such tools offer free thumbnail templates that you can customize.
But you shouldn’t rely solely on the CTR and focus on providing better user experience. You can assess the effectiveness of your title and thumbnail by checking video analytics – if there is a sharp drop in views at the beginning of the video, it indicates a mismatch between your video’s title and thumbnail and users’ expectations. In such a case, make sure to revisit your strategy.
Act On Your Audience Feedback
The feedback your audience leaves can say a great deal about how your content matches their expectations. If it’s mostly positive, it means that you’re doing a good job, and if not, you’ll be able to see how the audience feels.
Make sure to check comments to your videos and take note of what viewers find interesting or, vice versa, boring or irrelevant.
Another indicator of users’ attitude is the ratio between likes and dislikes. Note that dislikes are inevitable, but if there are too many of them, check whether:
- Your title and thumbnail closely reflect the content of the video
- The topic is relevant to your audience
- The quality of the video is appropriate
- The message the video conveys resonates with the audience/reflects the audience’s values
A high number of shares is also indicative of your audience’s positive reaction to the content. You can check these statistics in the Analytics report.
Find Relevant Topics
YouTube Analytics will show you how much your audience is interested in the niche you make videos about. Make sure to check the audience retention under the Engagement tab and see the average view duration and the average percentage viewed. The goal should be to keep the retention close to 100%, but on average it is between 50% and 60%. So if that’s your case, you are not doing half bad!
Then, depending on how long your content holds viewers’ attention, you can see topics that provoke interest and make more relevant content. This might improve your channel’s performance, and videos that consistently have high retention rates and watch time show up more often in suggested views on YouTube.
How to Use YouTube Analytics
Growing your YouTube channel entails exploring what content your audience wants to watch and providing high-quality and relevant videos. YouTube is a highly competitive platform, and to stand out, it’s crucial to track one’s performance. Luckily, YouTube Analytics offers a few helpful ways to do that and improve marketing strategy. If you make it a regular practice, success will not be long in coming.